1
Verify and Customize
Excel workbook
Verify the calculations, targets, ROI inputs, and deal-level evidence in a familiar spreadsheet.
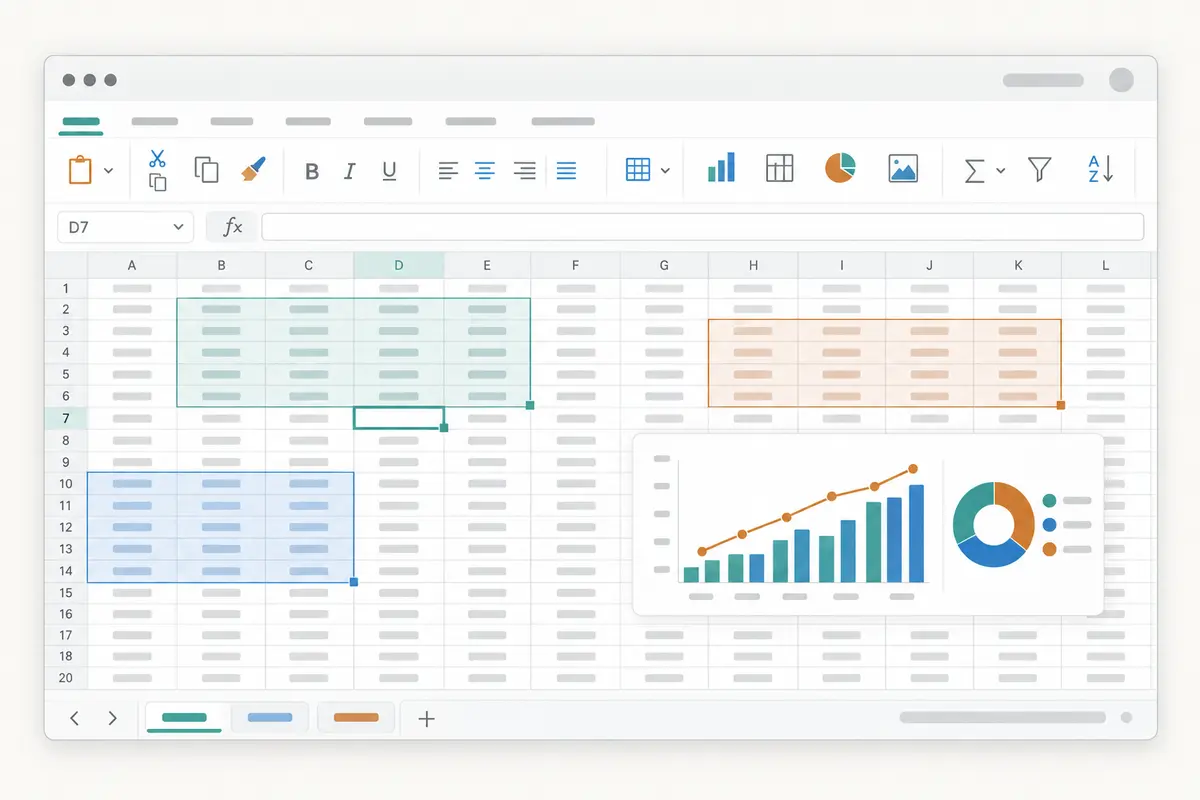
Build a complete HubSpot revenue report for the executives review. See what closed, what the team expects to close, how that compares with target, and which marketing spend produced revenue—then use the same numbers in Excel, PowerPoint, or a live dashboard.
Run it weekly, monthly, or quarterly. No separate exports. No spreadsheet joins. No rebuilt slide deck.
HubSpot and revenue operations work trusted by teams at






One meeting, five places to look
Closed revenue is in Deals. The team’s latest number is in Forecast. Targets are in Goals. Spend and attributed revenue are in Ads or Campaigns. Recurring revenue may use a separate set of fields again.
By the time those numbers reach Finance, someone has exported separate files, checked the periods and currencies, joined the rows in Excel, found the deals behind the change, and rebuilt the result in PowerPoint.
SWOTBee keeps that reporting setup together, so the next review starts with fresh data—not another reconciliation exercise.
A reusable revenue review
Set it up for the way your business measures revenue.
Pick the period, comparison, currency, pipelines, teams, regions, and campaigns that belong in the report.
Choose actual revenue, forecast, target, gap, pipeline, and ROI. Confirm which date and revenue value each number should use.
Review the result and use it in Excel, PowerPoint, or a live dashboard, with the same numbers in every version.
No digging through fields. No rebuilding filters. No hours copying and pasting.
One reporting setup
Check the calculations and deals in Excel. Take the decisions into PowerPoint. Share a live view when the audience needs the latest position. All three use the same period and definitions.
Shared reporting layer
The same measures and charts flow into every output.
Verify and Customize
Verify the calculations, targets, ROI inputs, and deal-level evidence in a familiar spreadsheet.
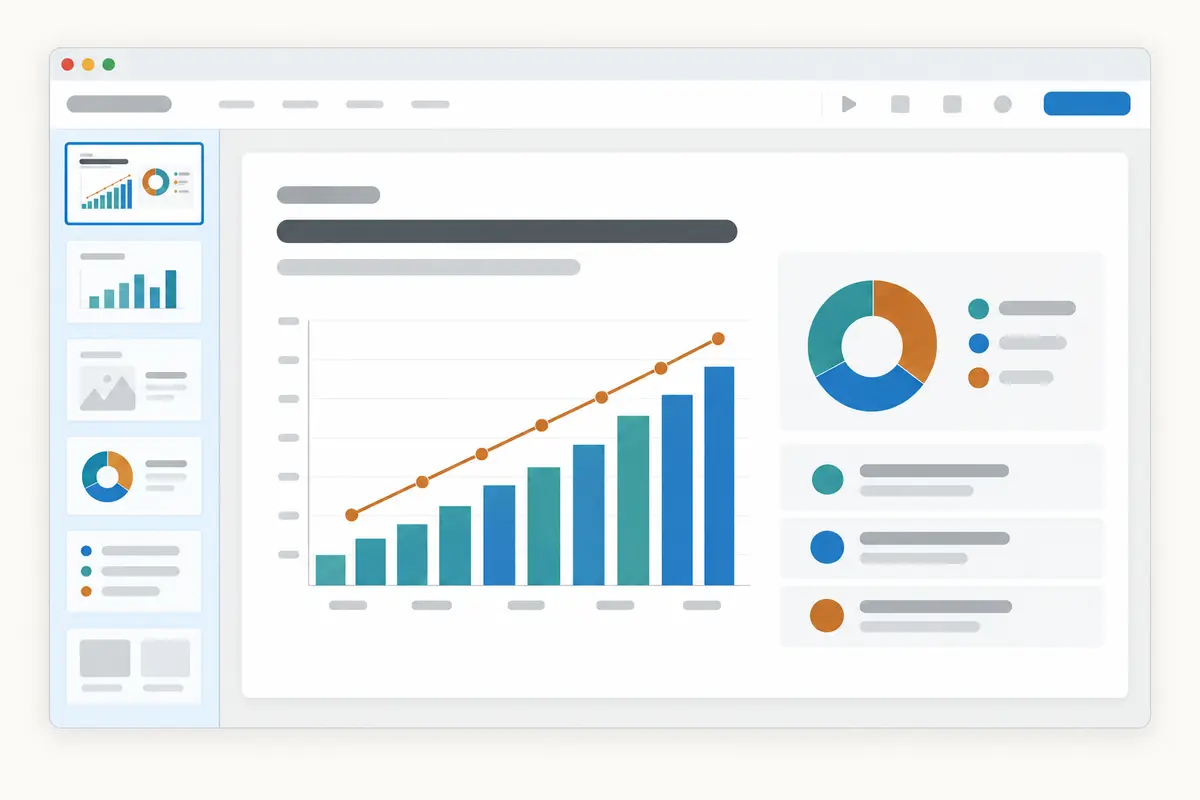
Present
Present the same approved figures and chart patterns as a clear revenue story.
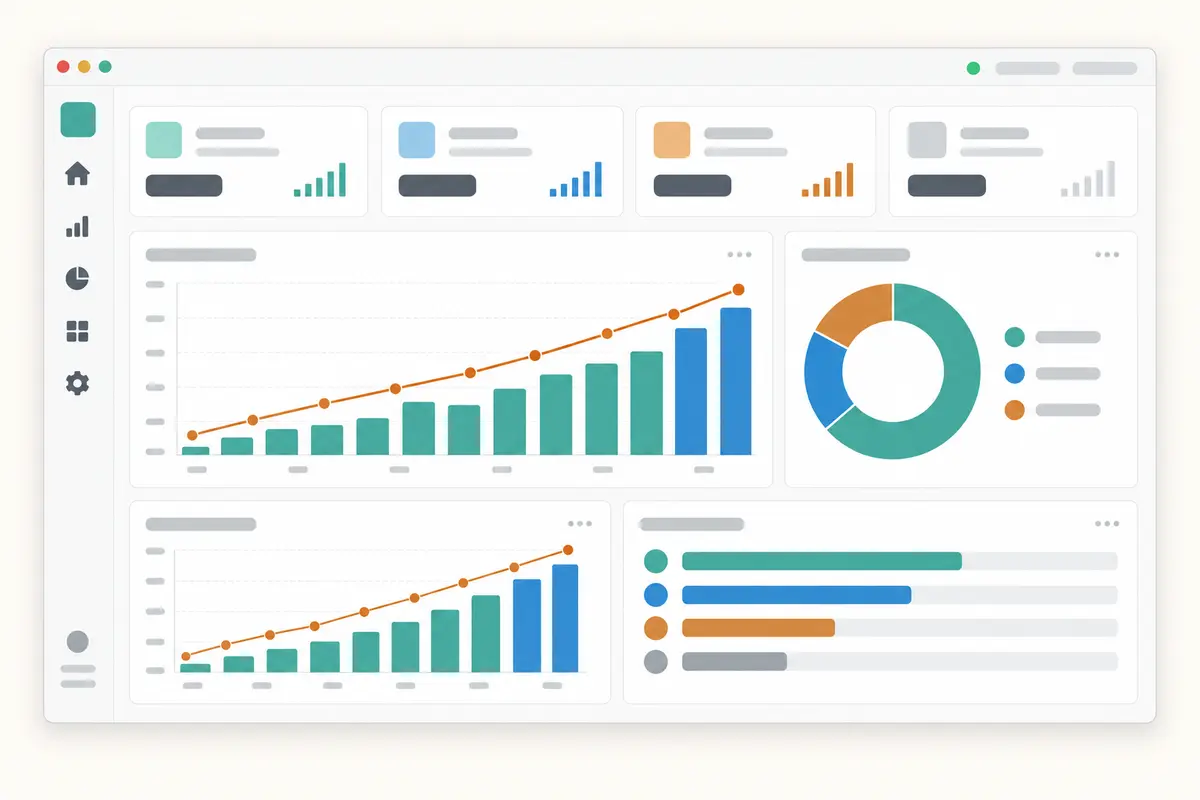
Share
Share a current revenue view without rebuilding the report or changing its definitions.
Inside the revenue report
Example dataStart with actual revenue, the latest forecast, the target, and the gap. Then show what changed and which deals require a decision.
Revenue, forecast and target
Updated 19 September 2026
Closed revenue
$684k
+$76kLatest forecast
$910k
-$35kQuarter target
$1.00m
Forecast gap
$90k
Target progress
The team needs another $90k in the forecast to reach the quarter target.
Reviewed summary
ApprovedForecast fell by $35k after two Mid-Market deals moved out of the quarter.
Enterprise remains $24k ahead of target. Three Mid-Market deals worth $194k need a close-date or confidence review.
Decision: Confirm which of the three deals remain in this quarter’s forecast.
Maya Chen · Enterprise
Forecast: Commit
What changed: Legal review due Friday
Next: Confirm signature date
Liam Ross · Mid-Market
Forecast: Best case
What changed: Decision date moved by 12 days
Next: Reconfirm close plan
Elena Park · Mid-Market
Forecast: Pipeline
What changed: No meeting booked this month
Next: Manager review
Built around the revenue review
Start with where revenue is likely to land, then show the target, the movement, the contributing deals, and the decisions the team needs to make.
Closed-won revenue, the agreed target, progress toward it, and the remaining gap for the same period and currency.
The latest team forecast, the previous submission, the change between them, and the deals responsible for that movement.
Open pipeline, likely revenue, coverage against the remaining target, and the opportunities that could change the outcome.
Revenue and forecast by owner, team, pipeline, region, product, segment, or another supported field used in your review.
Selected spend, attributed revenue, and the approved ROI calculation, with the inputs shown alongside the result.
Deals and missing inputs that need attention, the decision required, and an owner and due date for the next step.
The exact measures depend on the revenue fields, targets, forecast setup, campaign data, currencies, and permissions available in your HubSpot account. Missing inputs are identified for review rather than quietly treated as zero.
Need retention metrics instead? Use the dedicated HubSpot NRR and GRR reporting guide for recurring revenue, expansion, contraction, and churn.
Consistent comparisons
Point-in-time history
SWOTBee saves each reporting cutoff, so you can compare the forecast with what actually closed.
Built for the people who get things done
01 · Time back
02 · A reliable rhythm
03 · Less HubSpot admin
04 · Clearer decisions
Before you sign up
You choose what belongs in it. A report can include Closed Won revenue, the latest team forecast, forecast changes, revenue targets, the gap to target, open pipeline, selected campaign spend and return, the deals behind the numbers, and agreed actions.
Yes, when the matching deal, forecast, and goal data is available in your HubSpot account. The report uses the same period, pipelines, teams, and currency across the comparison and shows when an input is missing.
Yes. Excel carries the calculations and deal detail, PowerPoint provides an editable meeting-ready version, and a live dashboard can be shared when the audience needs the latest approved view. All three use the same reporting setup.
Yes. The editable presentation carries the revenue result, target gap, forecast change, main drivers, risks, and decisions into a shorter meeting-ready format. The supporting detail remains in Excel.
For eligible HubSpot accounts, the current Forecasts API provides read-only access to submitted forecasts and their change history. Availability depends on the account's HubSpot subscription, permissions, and forecast setup.
You first choose the spend, revenue value, attribution approach, currency, and period that should count. SWOTBee calculates return only when those inputs are available and labels the calculation used. It does not substitute a missing value or silently change the revenue definition.
Yes, when those tools and the required data are available in your HubSpot subscription. Revenue analytics and standard dashboards can answer common questions. The custom report builder can support a specific view across deals, goals, campaigns, or custom properties. SWOTBee packages the approved result for a recurring management review.
Use the finance or billing system when it owns the recognized, invoiced, or recurring revenue figure. HubSpot can still provide pipeline, forecast, attribution, and deal context. The report should name the source, period, currency, and calculation for every revenue metric so teams do not compare different definitions.
Yes, when the required recurring-revenue values and dates are available in HubSpot or the agreed billing source. NRR and GRR belong in a separate retention-revenue report because they need starting revenue, expansion, contraction, and churn—not the forecast and target view shown on this page. SWOTBee cannot reconstruct an earlier revenue state that was never recorded.
No. This signup records your work email and requested report so we can contact you about access. It does not create an app account or connect to your HubSpot portal.
One report solves today. A repeatable one solves every month.
We’ll help you organise your HubSpot revenue, forecast, targets, and ROI data into an Excel workbook, presentation, and dashboard—so you can spend less time reconciling numbers and more time deciding how to close the gap.
This part of our website is currently undergoing maintenance. We’ll email you with instructions for accessing the app.
As a courtesy, a member of our team will be available to personally help you get set up.
We apologize for the inconvenience and appreciate your patience.
No credit card required.
LinkedIn advertising cookies are set on every visit. Analytics cookies are off until you say yes, and the essential ones that make the site work are always on. See our Cookie Policy.