Use the data already there
Bring sales activities, deal stage, pipeline, conversion rates, and outcomes into the same performance report.
Bring pipeline, coverage, conversion, win rate, velocity, forecast, closed-won revenue, and targets into one clear report. Run it weekly, monthly, or quarterly.
Break down by pipeline, region, or team. No spreadsheet rebuilds. No slide deck rebuilds.
HubSpot and revenue operations work trusted by teams at






The recurring rebuild
The deals may already be in HubSpot, but the management report is usually spread across several dashboards, exports, spreadsheets, and last month's slide deck.
Near-identical reports get rebuilt for different pipelines and teams. Filters and definitions drift out of sync. Pipeline totals need reconciling, forecast figures need checking, and charts need updating before anyone can explain what changed.
SWOTBee keeps the scope, definitions, evidence, and presentation together, so the next review starts with the current pipeline story—not another blank workbook.
Use HubSpot. Skip the report rebuild.
Keep the sales process in HubSpot CRM. Give sales managers one clear view of performance and the deals that need action.
Bring sales activities, deal stage, pipeline, conversion rates, and outcomes into the same performance report.
Start with pre-built reports or sales analytics. Use the custom report builder when your reporting needs call for a specific view.
See sales performance, rep performance, sales goals, and the supporting deals without creating reports from scratch.
A reusable sales-reporting setup
Start with a complete sales-management report and make it fit the way your business measures the pipeline.
Pick the period and the pipelines, teams, regions, products, segments, or owners that belong in the report.
Select the measures your leadership team uses, along with their targets, definitions, and comparison periods.
Coverage against target · Stage conversion · Forecast by region
Review the figures, add the context only your team knows, and use the report in Excel, PowerPoint, or a live dashboard.
One reporting setup
Present the sales story in PowerPoint. Check the deal detail in Excel. Share a live view when people need to explore it themselves. Update the report, and all three versions stay aligned.
Shared reporting layer
The same measures and charts flow into every output.
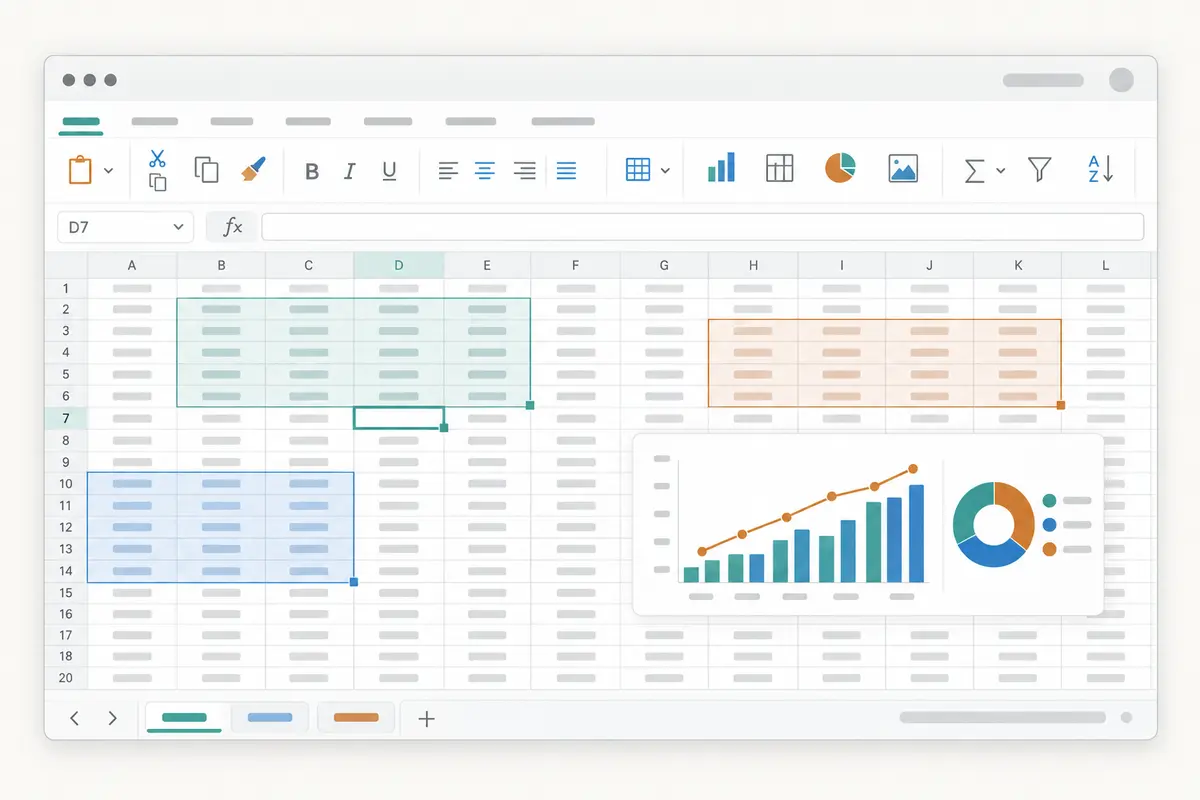
Verify and Customize
Verify every KPI, definition, target, and deal-level record in a familiar spreadsheet.
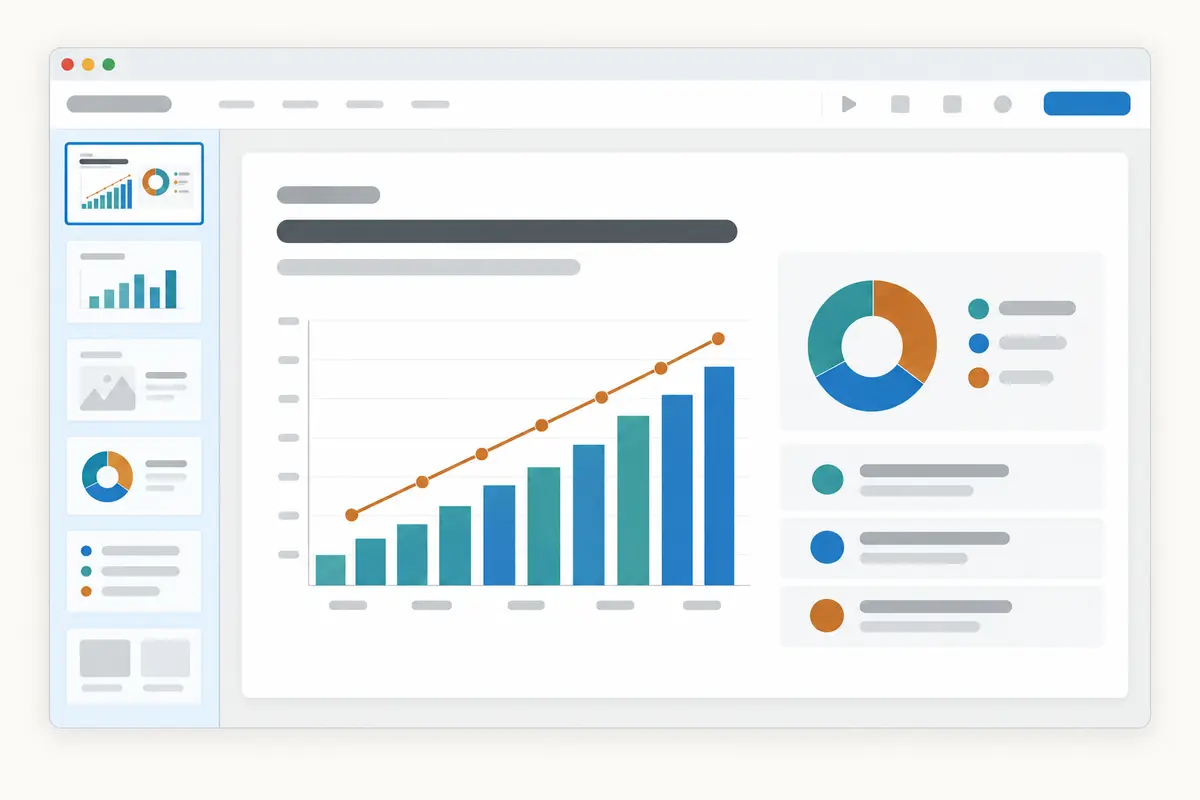
Present
Present the same approved measures and chart patterns as an executive sales story.
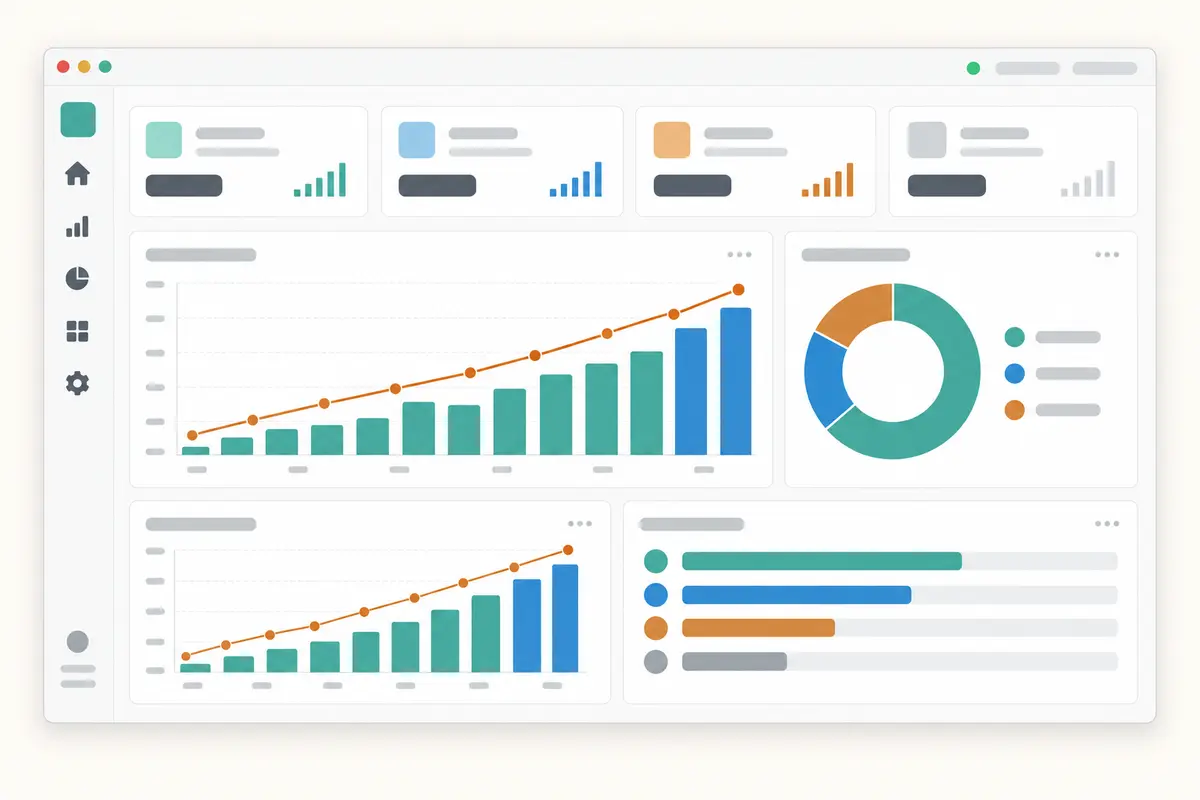
Share
Share a current sales view without rebuilding the report or sending another file.
Inside your sales report
Sample dataThe first view shows the current position, the change from the previous period, and the gaps that need attention. Below it, executives can see the teams, regions, and individual deals driving those results.
Sales and pipeline report
September 2026, compared with August 2026
Pipeline created
$1.84m
Up 18%Forward coverage
3.1×
Target 3.5×Win rate
24.6%
Down 2.3 ptsForecast
$1.18m
92% targetCoverage by region
Reviewed summary
ApprovedPipeline creation rose 18%, but win rate fell and forward coverage remains below target.
EMEA is the priority because its 2.3× coverage accounts for most of the company-wide gap.
Evidence: September pipeline and next-quarter target
Next action: Review EMEA creation plan and late-stage deals
Liam Ross · EMEA
Decision · 38 days
Why: Close date moved twice
Next: Confirm executive sponsor call
Elena Park · EMEA
Proposal · 29 days
Why: No activity for 12 days
Next: Agree next step with buyer
Maya Chen · North America
Discovery · 21 days
Why: Next step is overdue
Next: Update mutual action plan
Built around your sales review
Use the measures your leadership team already trusts, with the targets, comparisons, and deal evidence needed to interpret them.
New pipeline, open pipeline, coverage against target, and the teams, regions, products, or sources contributing to the position.
Conversion between pipeline stages, drop-off points, and the movement that explains where opportunities are progressing or stalling.
Wins, losses, closed-won revenue, average deal size, and performance against the agreed comparison period.
Sales-cycle length, time in stage, aging bands, stale opportunities, and the deals taking longer than expected.
Forecast position, committed and likely revenue, target attainment, and the remaining gap for the period.
Results by owner, team, pipeline, region, product, segment, or another supported dimension used in your sales review.
Consistent comparisons
Point-in-time history
SWOTBee saves each reporting cutoff, so you can compare the pipeline over time.
Built for the people who get things done
01 · Time back
02 · A reliable rhythm
03 · Less HubSpot admin
04 · Clearer decisions
Before you sign up
Yes. HubSpot includes sales dashboards, pre-built reports, sales analytics, and custom reporting options depending on your subscription. SWOTBee uses the sales data and definitions available in your HubSpot CRM to produce a repeatable report for management review.
Common sales reports cover pipeline, funnel conversion, sales activities, win rate, deal velocity, forecast, target attainment, and team performance. Choose the measures that support the decision your sales managers need to make, rather than adding every available metric.
The sales analytics tool provides ready-made views for common sales questions. The custom report builder lets eligible HubSpot accounts combine selected data and fields for a specific reporting need. SWOTBee turns the approved view into a recurring Excel, PowerPoint, and dashboard pack.
Yes, when the required activities and ownership data are recorded consistently in HubSpot. The report can connect calls, meetings, emails, deal movement, and outcomes so sales leaders can review activity in context instead of treating volume as performance.
It is a recurring management report built from selected HubSpot Sales Hub data. It brings pipeline, conversion, win rate, velocity, forecast, closed-won revenue, targets, supporting deals, and commentary into one report for a sales, executive, board, or investor review.
Depending on the data available in your HubSpot account, the report can include pipeline created, pipeline coverage, stage conversion, win rate, deal velocity and aging, forecast, closed-won revenue, and target attainment. Results can be broken down by supported fields such as owner, team, pipeline, region, product, source, or segment.
Yes. Pipelines can be reported separately or combined when the underlying stages and definitions are genuinely comparable. The report keeps the included scope visible so unrelated pipelines are not silently mixed.
Yes, when HubSpot provides comparable period data or SWOTBee has stored the required point-in-time snapshot. The same agreed definition and scope are used on both sides of the comparison.
Yes. The report can include the forecast measures, categories, probabilities, targets, and deal evidence supported by your HubSpot setup. The calculation basis and reporting date remain visible.
Yes. Excel carries the management summary and supporting deal data, PowerPoint provides an editable meeting-ready story, and a live dashboard can be shared when the audience needs a current view. All three use the same reporting setup.
No. HubSpot remains the operational data source. SWOTBee turns selected sales data into a repeatable management pack with consistent definitions, comparisons, evidence, and reusable outputs.
Only when the historical state is available from HubSpot or was previously captured. If it is unavailable, snapshot collection can begin now so future reports have the point-in-time history they need.
No. This signup records your work email and requested report so we can contact you about access. It does not create an app account or connect to your HubSpot portal.
One report solves today. A repeatable one solves every month.
We’ll help you organise your HubSpot pipeline, coverage, conversion, velocity, and forecast into an Excel workbook, presentation, and dashboard—so you can spend less time rebuilding reports and more time acting on what changed.
This part of our website is currently undergoing maintenance. We’ll email you with instructions for accessing the app.
As a courtesy, a member of our team will be available to personally help you get set up.
We apologize for the inconvenience and appreciate your patience.
No credit card required.
LinkedIn advertising cookies are set on every visit. Analytics cookies are off until you say yes, and the essential ones that make the site work are always on. See our Cookie Policy.