Your board wants to see NRR. Your CFO wants GRR. Your CS leader wants renewal rate by segment. And HubSpot doesn’t have a native report for any of them.
This isn’t a gap in your HubSpot setup, it’s a gap in HubSpot itself. The platform tracks deal revenue beautifully, but it doesn’t natively calculate the retention metrics that recurring-revenue businesses need.
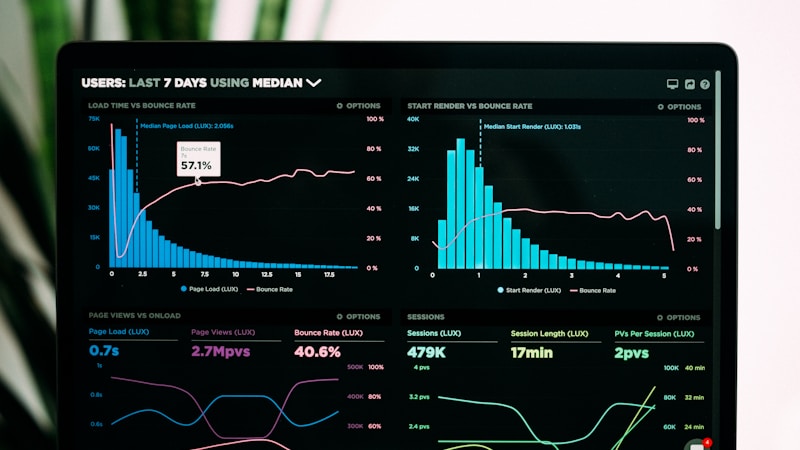
The good news: you can build these dashboards with custom properties, calculated fields, and HubSpot’s custom report builder. This article shows you how.
These are the revenue metrics every RevOps team reports on: monthly recurring revenue (MRR), annual recurring revenue (ARR), and the retention metrics built on top of them. HubSpot tracks deal revenue, but calculating NRR, GRR, and renewal rate from it takes deliberate setup. We will cover the revenue reporting you can do inside HubSpot, and where you still need Google Sheets to finish the math. For the metric definitions themselves, see our guide to SaaS renewal metrics and the deep dive on gross vs net revenue retention.
This article is part of our Complete Guide to Building a Renewal Pipeline in HubSpot.
Reporting Depends On Renewal Deal Hygiene
NRR and GRR dashboards only work if renewal deals are created consistently. If some renewals are cloned manually, some are spreadsheet-tracked, and some are missing line items or previous contract value, the dashboard becomes a debate instead of a decision tool.
Before building the reports below, verify the operational layer: renewal deal automation, renewal pipeline properties, and line-item cloning for renewal deals. The metric layer should summarize clean renewal data, not compensate for missing workflow design.
What These Metrics Tell Sales, Success, And Finance
Net revenue retention rate and gross retention rate are the two numbers that answer different questions about the same customer base. Retention rate on its own tells you whether subscription customers stuck around; net revenue retention rate tells you whether the customer mix as a whole grew or shrank in dollar terms once expansion, contraction, and churn are netted out. Customer success teams watch it as a post-sales health signal; finance watches it as a revenue growth driver; the board watches it as one of the handful of KPIs that predicts whether growth is durable.
The key drivers worth breaking out separately, rather than reporting one blended number, are: new logo growth, expansion within the existing customer base, contraction (downgrades that don’t fully churn), and churn itself. A cohort analysis by renewal year, month, or contract-start date usually reveals which driver is actually moving the number, better retention in year one accounts often masks weaker retention in year three, for example, and that pattern only shows up once you segment.
The Four Metrics You Need
Before building anything, let’s align on definitions:
Renewal Rate
Formula: (Number of renewed deals ÷ Total deals up for renewal) × 100
What it tells you: What percentage of customers who could have renewed actually did. This is a count-based metric, it treats a $500/month customer the same as a $50,000/month customer.
Benchmark: 85, 95% for B2B SaaS according to ChartMogul’s SaaS Retention Report. Lower for transactional businesses, higher for enterprise contracts.
Gross Revenue Retention (GRR)
Formula: (Starting MRR − Contraction − Churn) ÷ Starting MRR × 100
What it tells you: How much revenue you’re retaining from existing customers, ignoring expansion. GRR can never exceed 100%. If your GRR is 95%, you’re losing 5% of revenue to downgrades and churn. For a deeper comparison, see ChartMogul’s breakdown of gross vs. net retention.
Benchmark: 90%+ is healthy. Below 85% is a red flag.
Net Revenue Retention (NRR)
Formula: (Starting MRR + Expansion − Contraction − Churn) ÷ Starting MRR × 100
What it tells you: Your total revenue trajectory from existing customers, including upsells. NRR above 100% means you’re growing from existing customers alone, even without new business. Baremetrics’ guide to net revenue retention walks through the formula in detail.
Benchmark: 110%+ is excellent. 100, 110% is solid. Below 100% means you’re shrinking. SaaS Capital’s benchmark data shows a median NRR of 104% for private SaaS companies. But as Jason Lemkin warns, high NRR can mask serious retention problems if a few large accounts expand while many small ones churn.
Churn Rate
Formula: (Churned MRR ÷ Starting MRR) × 100
What it tells you: How fast you’re losing revenue. Track monthly and annually.
Benchmark: <2% monthly / <5% annual for healthy B2B businesses. Vitally’s SaaS churn benchmarks break this down further by company size and segment.
Properties You Need First
These dashboards depend on clean property data. Make sure you have:
| Property | Type | Used For |
|---|---|---|
| Deal Type | Dropdown (New Business, Renewal, Expansion, Contraction) | Segmenting revenue by type |
| Renewal Date | Date | Tracking when renewals were due |
| Previous Contract Value | Currency | Calculating expansion/contraction |
| Revenue Change Reason | Dropdown | Understanding why amounts changed |
| Churn Reason | Dropdown | Analyzing lost revenue |
| Contract Term | Number (months) | Annualizing MRR calculations |
| Renewal Year | Number | Tracking cohort performance |
Dashboard 1: The Operational Dashboard (For CSMs)
This dashboard answers: “What needs my attention today?”
Report 1: Renewal Pipeline by Stage
Type: Deal funnel report Data source: Deals in Renewal Pipeline Visualization: Horizontal bar chart Breakdown: Deal stage Filter: Close date is this quarter
Shows how many deals are at each stage and total pipeline value per stage.
Report 2: Upcoming Renewals (Next 30/60/90 Days)
Type: Custom report Data source: Deals Filters: Pipeline = Renewal, Deal Stage is not Closed Won or Closed Lost Columns: Company name, Deal amount, Renewal date, Days to renewal, Deal owner, Health score Sort: Days to renewal (ascending)
This is your CSM’s daily worklist.
Report 3: Overdue Renewals
Type: Deal list Filters: Pipeline = Renewal, Renewal Date < Today, Stage is not Closed Won or Closed Lost Visualization: Table with red highlighting Columns: Company, Amount, Days overdue, Owner
Any deal on this list needs immediate attention.
Report 4: At-Risk Accounts
Type: Custom report Filters: Pipeline = Renewal, Health Score = “At Risk” or “Passive” Columns: Company, Health score, Renewal date, Last activity date, Open support tickets
Dashboard 2: The Revenue Dashboard (For Leadership)
This dashboard answers: “Are we retaining and growing revenue?”
Report 5: Renewal Rate by Quarter
Type: Custom report Calculation: Count of Closed Won renewals ÷ Count of all closed renewals (Won + Lost) per quarter Visualization: Line chart with quarterly data points How to build it in HubSpot:
- Create a report → Custom Report Builder
- Data source: Deals
- Filter: Deal Type = Renewal, Pipeline = Renewal Pipeline
- Rows: Close Date (quarterly)
- Columns: Count of deals, segmented by “Deal Stage” (Closed Won vs Closed Lost)
- Calculate percentage in a downloaded spreadsheet (HubSpot can’t do the division natively in the report builder)
Workaround for in-platform calculation: Use Operations Hub to create a “Renewal Outcome” calculated property that flags Won/Lost, then build a report that counts each value per quarter.
Report 6: Revenue Segmentation by Deal Type
Type: Custom report Data source: Deals Visualization: Stacked bar chart Rows: Close Date (monthly or quarterly) Columns: Sum of Amount, broken down by Deal Type (New Business, Renewal, Expansion, Contraction)
This one chart tells leadership: “How much of our closed revenue is new vs. recurring vs. growth?”
Report 7: NRR Trend (Manual Calculation)
HubSpot can’t calculate NRR natively. Here’s the workaround:
- Export data monthly: All deals closed this month, segmented by Deal Type
- Spreadsheet formula:
- Starting MRR = Sum of all active contracts at month start
- Expansion = Sum of closed-won Expansion deals
- Contraction = Sum of Contraction deals (or renewal deals where Amount < Previous Contract Value)
- Churn = Sum of closed-lost Renewal deals
- NRR = (Starting MRR + Expansion − Contraction − Churn) ÷ Starting MRR
- Track monthly in a spreadsheet or BI tool
- Display in HubSpot using a custom report that shows the component parts (even if the final calculation is manual)
For teams with Operations Hub Enterprise, you can use datasets and calculated fields to get closer to an automated NRR report, but it still requires some manual setup.
Report 8: Churn Analysis by Reason
Type: Custom report Data source: Deals Filters: Deal Type = Renewal, Stage = Closed Lost Visualization: Pie chart or horizontal bar Breakdown: Churn Reason property Time range: Last 12 months
This tells you why you’re losing customers, which is more actionable than just knowing that you’re losing them.
Dashboard 3: The Forecast Dashboard (For Finance)
This dashboard answers: “What revenue can we expect next quarter?”
Report 9: Renewal Revenue Forecast by Month
Type: Deal forecast report Data source: Deals in Renewal Pipeline Visualization: Bar chart Rows: Renewal Date (monthly) Columns: Weighted deal amount (amount × stage probability)
Critical: Make sure your stage probabilities reflect renewal reality (85, 95%), not sales reality (20, 40%). See why your renewal forecast is wrong.
Report 10: Pipeline Velocity
Calculation: (Number of deals × Average deal value × Win rate) ÷ Average days in pipeline
This tells you how fast revenue moves through your renewal pipeline. Track monthly and watch for slowdowns.
Segment your dashboard by revenue type: renewal vs. expansion to keep the numbers clean.
HubSpot’s Built-In Revenue Analytics
If you have Sales Hub Enterprise, HubSpot offers a “Revenue Analytics” tool under Reports. It provides:
- Recurring revenue tracking (if you use HubSpot’s native recurring revenue properties)
- Renewal forecasting
- Churn tracking
The catch: It requires you to use HubSpot’s specific recurring revenue properties and line item setup. If you’ve been tracking renewals with custom properties (which most teams do), you may need to migrate your data model to use it.
It’s worth evaluating, but most mid-market teams find custom dashboards more flexible.
Tracking Recurring Revenue in HubSpot
Before the dashboards, get your recurring revenue data right. Whether you track HubSpot MRR through native recurring revenue properties or custom objects, the goal is a real-time, single source of revenue data in your core CRM.
Start with where the fields live. HubSpot’s recurring revenue properties sit on the deal record: Annual recurring revenue (ARR), Monthly recurring revenue (MRR), Annual contract value (ACV), and Total contract value (TCV). They are calculated automatically from line items, using each line item’s recurring billing frequency and term, so they are only as accurate as your line-item hygiene. If you skip line items and type amounts directly onto deals, these fields stay empty and both Revenue Analytics and your custom revenue reports lose their data source.
Dashboards consume these properties the same way they consume any deal field: sum ARR or MRR in the custom report builder, break it down by Deal Type or pipeline, and trend it by close date. Teams that cannot use line items can mirror the same idea with custom currency properties (a manual “ARR” field populated by workflow), which keeps the dashboards below working at the cost of automatic calculation. A few notes on making the numbers meaningful:
- Track recurring revenue by tier and pricing model. Segment MRR by plan tier so HubSpot revenue reporting shows where growth comes from. If you run usage-based pricing, model how revenue changes as usage grows; see forecasting usage-based revenue.
- Separate new customers from existing. Landing new customers grows MRR, but revenue retention in HubSpot is about keeping and growing existing accounts. Report both so the sales team and leadership see acquisition and retention side by side.
- Watch year-over-year. Compare NRR and renewal rate year-over-year to see whether the business is getting stickier, a key driver of unit economics for both SMB and enterprise customers.
These inputs feed every dashboard below, and they connect retention to customer acquisition cost in your broader unit economics.
Pro Tips
- Automate the data, not the math. Use workflows to ensure Deal Type, Renewal Date, and Previous Contract Value are always populated. The math can happen in reports or spreadsheets.
- Snapshot monthly. Create a monthly workflow that captures “MRR as of [date]” in a custom property on the company record. This gives you historical data points for trend analysis.
- Don’t mix pipeline reports. Always filter by Pipeline = Renewal Pipeline. Cross-pipeline reports are useful for total revenue, but they’ll double-count if you’re not careful.
- Report on cohorts. Filter by “Renewal Year” to see if Year 2 customers renew at higher or lower rates than Year 1. This tells you whether your product is getting stickier over time.
- Benchmark externally. Compare your NRR against public cloud companies using the BVP Nasdaq Emerging Cloud Index, or against private SaaS using David Skok’s SaaS Metrics 2.0 framework.
Frequently Asked Questions
What is net revenue retention in HubSpot? Net revenue retention (NRR) is a calculated metric, not a native field: (starting MRR + expansion, less contraction, less churn) divided by starting MRR for a cohort of existing customers, over a period. HubSpot stores the deal-level inputs (MRR, ARR, close date, deal type) but does not ship a report that rolls them into NRR, you build that with custom properties and the custom report builder, covered above.
Does HubSpot calculate NRR and GRR automatically with workflows? No. Workflows automate the inputs, keeping Deal Type, Renewal Date, and Previous Contract Value populated, but the NRR/GRR calculation itself happens in a custom report or dashboard, not inside a workflow. Sales Hub Enterprise’s Revenue Analytics tool gets closer to automatic, but only if your data already sits in HubSpot’s native recurring revenue properties.
What is HubSpot NRR reporting used for if there’s no native report? Board and CFO reporting on retention and expansion. Most mid-market teams build it as a custom dashboard on top of deal-level ARR/MRR properties, segmented by Renewal Year or pipeline, rather than waiting on a native HubSpot NRR report to exist.
Building renewal dashboards that your board can actually use is harder than it looks. SWOTBee builds NRR/GRR reporting for mid-market teams in Energy, Manufacturing, and SaaS, from property setup to executive-ready dashboards.