This branch is part of HubSpot Management Reporting: A Practical System for 2026.
A useful HubSpot weekly sales report is a fixed-cutoff scorecard that explains pipeline creation, movement, closed outcomes, forecast risk, and the few named deals requiring a decision. This report template gives sales managers and sales reps one shared view of performance without turning every Sales Hub metric into a leaderboard.
Download the weekly sales workbook and 30-minute meeting agenda to use the template with fictional example data first.
What is a weekly sales report?
A weekly sales report is an operating view of what changed since the same cutoff last week, why it changed, and what the team will do next. HubSpot’s own weekly-sales guidance recommends defining the audience, limiting the metric set, and adding context rather than reporting every available number.
The weekly report has three layers:
- Scorecard: the small set of outcomes and leading indicators that deserve attention.
- Evidence: named deals and reconciled movements behind each material change.
- Decisions: actions, owners, due dates, and items carried into the next review.
The audience changes the emphasis. A rep coaching report may show prospecting outcomes and conversion. A sales leadership report should emphasize pipeline creation, forecast, target gap, movement, risks, and intervention. An executive report should be even narrower.
How do you create a weekly sales report in HubSpot?
Create a weekly sales report in HubSpot by defining the cutoff and audience first, then assembling a small set of saved or custom reports into one sales dashboard. The report should connect sales activities to pipeline and revenue outcomes without confusing activity volume with sales performance.
Use this sequence:
- Choose the audience and decision. A sales manager, rep, and executive need different levels of detail from the same sales data.
- Set the reporting period and filters. Fix the pipeline, team, owner, currency, close-date horizon, and weekly cutoff.
- Start with available Sales Hub reports. HubSpot’s sales analytics suite includes reports for pipeline health, outcomes, progress, and expected performance, depending on the subscription and portal setup.
- Create custom reports only for missing decisions. Use the report builder when the standard HubSpot report does not provide the required cohort, comparison, or record-level evidence.
- Build the dashboard in decision order. Put outcomes first, then the pipeline report, forecast and coverage, health exceptions, sales-cycle measures, and supporting sales metrics.
- Reconcile the output. Confirm that dashboard totals trace to the same deal set used by the weekly pipeline bridge and named-deal review.
This approach works for a weekly sales report template because it keeps the sales process visible from activity through conversion, without mixing sales and marketing measures that use different cohorts. Marketing and sales teams can share definitions, but each metric still needs one owner and one decision.
Which HubSpot sales reporting dashboards belong in the weekly review?
Use one focused sales reporting dashboard rather than several disconnected dashboards. The weekly view should show the sales team’s performance through outcomes, pipeline movement, forecast, risk, and only the activity measures that explain a change.
The most useful dashboard blocks are closed-won and closed-lost results, created pipeline, current open pipeline, the week-over-week pipeline bridge, forecast versus target, coverage, stale or overdue deals, win rate, average sales cycle, and named exceptions. This combination lets sales leaders track sales progress while still opening the underlying deals when a number needs explanation.
Other types of sales reports can remain outside the weekly meeting. A monthly sales report can carry longer trend analysis. A sales content analytics report belongs in an enablement review. A detailed sales funnel or journey report belongs in a conversion diagnostic. Add one of these only when it changes a weekly decision.
Set the weekly reporting contract first
Comparing Friday afternoon this week with Monday morning last week introduces several days of activity and makes the trend unreliable. Choose one cutoff and keep it stable.
Record:
Cutoff: Friday 17:00 Europe/London
Comparison: Previous Friday 17:00 Europe/London
Pipelines: New Business and Expansion
Currency: USD company currency
Open pipeline: Deals not in approved closed stages
Actual: Closed-won deal amount by close date
Forecast: Closed actual plus approved forecast categories
Owner: Sales Operations
Preserve the timezone and effective cutoff in the output. If a scheduled HubSpot email captures data before its delivery time, use the actual data cutoff rather than the email arrival time.
Which KPIs deserve weekly review?
Start with ten blocks. Remove any block that does not lead to a decision.
| KPI | Weekly question | Required context |
|---|---|---|
| Pipeline created | Did we add enough qualified value? | Definition of created and qualification stage |
| Open pipeline | What value is currently available? | Pipeline, currency, close-date horizon |
| Pipeline movement | Why did opening become closing? | Created, reopened, won, lost, removed, amount change |
| Closed won | What was achieved this week? | Bookings or other approved value basis |
| Closed lost | What value and patterns were lost? | Loss reason quality and cohort |
| Forecast vs target | Are we on plan? | Actual, forecast, target, gap, cadence |
| Coverage | Can open pipeline support the gap? | Historical win rate and time remaining |
| Win rate | Are closed outcomes converting? | Cohort and denominator |
| Cycle time | Are deals taking longer to close? | Entry point and closed cohort |
| Health exceptions | Which deals threaten the forecast? | Stale, overdue, slipped, missing next step, bad data |
Do not assume one universal coverage threshold or sales cycle. Compare the ratio with your own historical outcomes, segment mix, win rate, and remaining time.
What should be excluded?
Exclude metrics that have no decision attached. Raw call, email, and task totals can be useful for capacity or coaching, but they are not management outcomes by themselves.
Use activity when it answers a specific question:
- Are new leads receiving a timely response?
- Is pipeline creation falling because contact rates changed?
- Does one stage have insufficient follow-up?
- Does a rep need coaching on meeting conversion?
Do not reward activity volume that creates no qualified pipeline or customer progress.
Compare this week with last week
A current pipeline report cannot fully explain historical movement after deal properties have changed. Preserve deal-level snapshots at the same cutoff.
For each deal, capture:
record ID
deal name
owner and team
pipeline and stage
amount in company currency
create date and close date
forecast category
last meaningful activity
next activity date
snapshot timestamp
Join the current and previous snapshots by record ID. Classify every open-pipeline record:
- Created: absent previously and open now.
- Reopened: previously closed and open now.
- Progressed: stage order increased.
- Regressed: stage order decreased.
- Won: previously open and closed won now.
- Lost: previously open and closed lost now.
- Slipped: close date moved beyond the agreed tolerance.
- Expanded or contracted: amount changed.
- Removed: previously open and now absent, requiring investigation.
- Unchanged: none of the primary movements applies.
The pipeline bridge must reconcile:
Closing open pipeline
= Opening open pipeline
+ New and reopened deals
+ Amount increases
- Closed won removed from open pipeline
- Closed lost removed from open pipeline
- Removed deals
- Amount reductions
Stage progression and close-date slips explain quality and timing, but do not add or subtract value unless they change inclusion or amount.
Worked weekly pipeline example
This fictional example uses the same scope, currency, and cutoff method at both dates.
| Movement | Value |
|---|---|
| Opening pipeline | $2,400,000 |
| New or reopened deals | +$450,000 |
| Amount increases | +$75,000 |
| Closed won removed from open pipeline | -$180,000 |
| Closed lost removed from open pipeline | -$95,000 |
| Amount reductions | -$40,000 |
| Closing pipeline | $2,610,000 |
Check the arithmetic:
$2,400,000 + $450,000 + $75,000 - $180,000 - $95,000 - $40,000
= $2,610,000
The net increase is $210,000, but that number alone hides the operating story. The report should list the largest created deals, amount changes, wins, losses, slips, and removals beneath the bridge. Every material movement must trace back to a record ID.
For the detailed movement model, use the HubSpot pipeline change dashboard. If earlier states were not preserved, the historical pipeline snapshot workflow explains what to capture going forward.
Write commentary that ends with a decision
For each material KPI, capture:
- current value
- comparison value
- target or tolerance
- observation
- explanation and evidence
- decision, owner, and due date
Example:
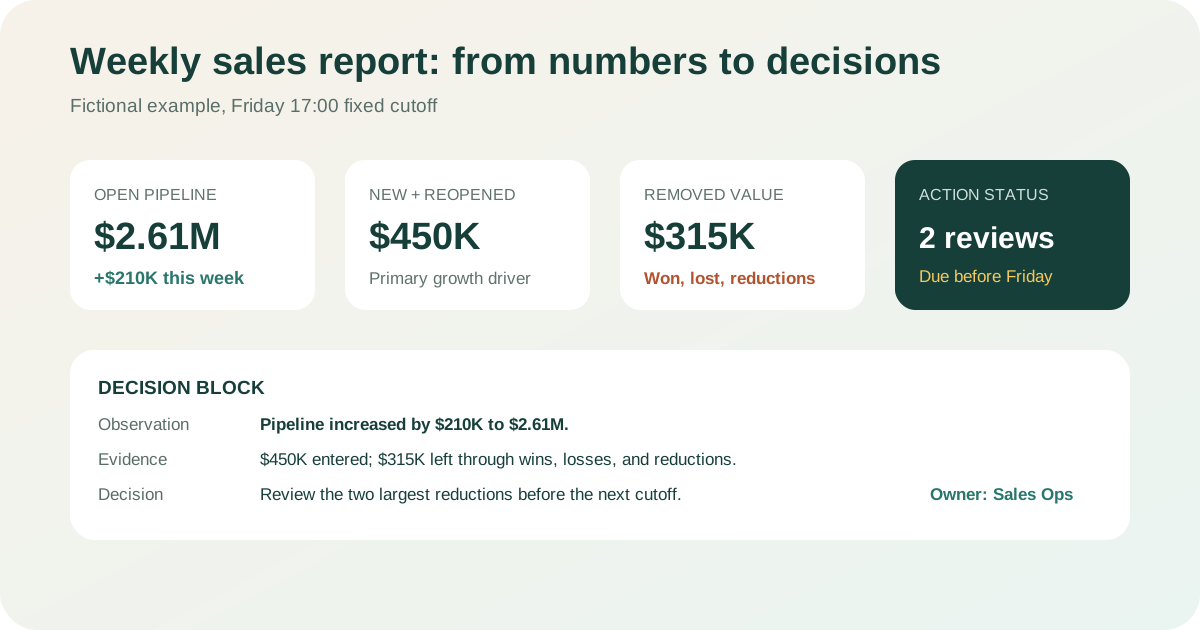
Current: Closing pipeline is $2.61 million.
Comparison: Up $210,000 from $2.40 million last Friday.
Target/tolerance: Weekly created-pipeline plan and approved movement rules.
Observation: Net pipeline grew, but $135,000 was lost or reduced.
Evidence: $450,000 new or reopened, $75,000 expansion, $180,000 won,
$95,000 lost, and $40,000 contracted.
Decision: Review the two largest reductions before Friday.
Owner/date: Sales Operations, next weekly cutoff.
The observation states what changed. The explanation names the movements. The evidence reconciles. The decision changes future action.
Which named deals should appear beneath the KPIs?
Do not show the entire pipeline. Show exceptions that can change the decision:
| Exception | Suggested rule | Management action |
|---|---|---|
| Largest new deals | Top value entering qualified scope | Validate source, need, next step, and close date |
| Largest slips | Close date moved beyond tolerance | Confirm cause and forecast effect |
| Stale deals | No meaningful activity beyond stage tolerance | Advance, remediate, or close |
| Overdue close date | Open with close date before cutoff | Correct date and forecast category |
| Amount reduction | Material week-over-week decrease | Record commercial reason and effect |
| Stage regression | Current stage earlier than prior stage | Review qualification and recovery plan |
| Forecast mismatch | Stage evidence conflicts with category | Correct governance or record |
| Missing owner or next step | Required operating field absent | Assign accountability before review ends |
The pipeline health dashboard provides the detailed stale, aging, close-date, and ownership checks. Use the sales velocity report when the weekly issue is caused by opportunity count, average deal size, win rate, or cycle length.
Run the weekly sales review in 30 minutes
Distribute the workbook before the meeting and ask owners to add evidence. Use the meeting for decisions, not data discovery.
Minutes 0 to 3: confirm the contract
Confirm cutoff, scope, currency, target, comparison, and unresolved QA issues. If the report does not reconcile, label it provisional.
Minutes 3 to 8: review outcomes
Review closed won, closed lost, target attainment, and forecast gap. Separate achieved actual from forecast and open pipeline.
Minutes 8 to 15: explain pipeline movement
Review the bridge, then open only the named deals driving created value, loss, slippage, expansion, contraction, or removal.
Minutes 15 to 22: test forecast and health
Review coverage in context, forecast-category changes, stale deals, overdue close dates, missing next steps, and data-quality failures.
Minutes 22 to 27: diagnose drivers
Review conversion, win rate, average deal size, cycle time, and velocity only where they explain the current result.
Minutes 27 to 30: confirm decisions
Read back each decision, owner, due date, and evidence required next week. Carry unresolved items into the next report rather than losing them in meeting notes.
Copy the workbook, pipeline bridge, exception table, and 30-minute agenda. The files are editable and include fictional data, formulas, QA tests, and a matching slide deck.
When is a spreadsheet no longer enough?
A governed spreadsheet is the right starting point when the team is still agreeing definitions and the weekly report has one owner. Automate when the process is stable and repeated effort or error becomes material.
| Signal | Appropriate next step |
|---|---|
| Definitions change every week | Stabilize the KPI dictionary first |
| One report and a small deal set | Keep the controlled workbook |
| Manual exports delay the meeting | Automate snapshot capture and refresh |
| Several pipelines need the same model | Centralize mappings and calculations |
| Slides regularly disagree with the workbook | Generate outputs from governed ranges |
| Owners cannot trace totals to deals | Fix the evidence model before adding charts |
The HubSpot sales and pipeline reporting page maps the recurring report options across core pipeline, executive, KPI, forecasting, live-dashboard, Excel-export, and board-reporting jobs.
Whether the report stays manual or becomes automated, keep one final rule: every material number must have a stable definition, a comparable cutoff, named evidence, and an owner for the next action.