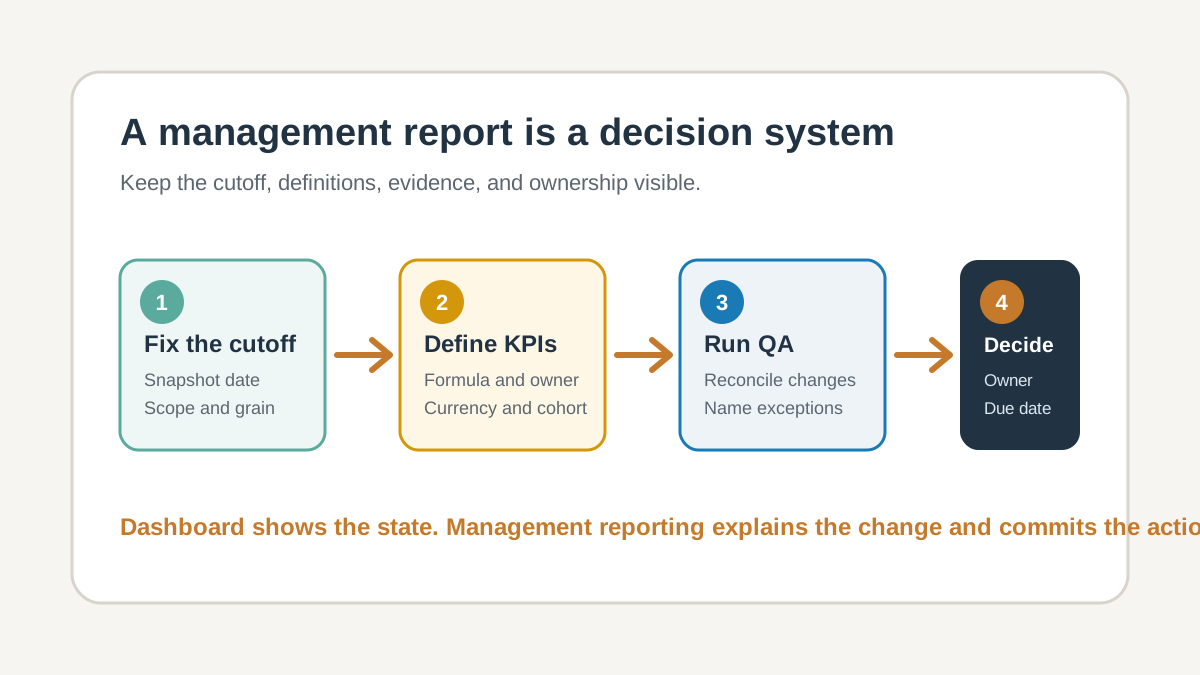
HubSpot management reporting should be a repeatable decision system, not a monthly collection of screenshots. Fix the reporting cutoff, govern each KPI definition, reconcile what changed, review the exceptions, and finish with a decision, owner, and due date. HubSpot reporting tools supply the live CRM data and analytics; the management process makes that data comparable and actionable.
That system can use HubSpot dashboards for live visibility and still use a fixed workbook and deck for management review. The two formats solve different jobs. A dashboard shows the current state. A management pack preserves the evidence used to explain a change and commit an action.
Download the free HubSpot management reporting starter pack. It includes an editable Excel workbook, an eight-slide PowerPoint deck, KPI dictionary, QA checklist, 30-minute meeting agenda, and commentary prompts. No email is required.
What does a management report need that a HubSpot dashboard does not?
HubSpot’s custom report builder can combine CRM data sources, apply filters, create visualizations, save custom reports to dashboards, and export unsummarized data. HubSpot also supports recurring dashboard shares by email, Slack, and Google Chat. These are useful distribution and analysis capabilities.
They do not automatically make a management report trustworthy.
A management report needs four controls around the charts:
- A fixed cutoff. Everyone reviews the same state of the data.
- A definition contract. Target, revenue, forecast, pipeline, and conversion metrics mean the same thing in every meeting.
- A reconciliation. The report explains why a balance changed rather than showing two unrelated totals.
- A decision record. Material variances become actions with owners and dates.
This matters because HubSpot reports are not static. HubSpot says new data can take time to appear, custom reports refresh automatically as data becomes available, and a user can manually refresh a report or dashboard. A live number is excellent for operational monitoring. It is a weak audit trail unless the review also preserves its cutoff and scope.
How do you create and manage reports and dashboards in HubSpot?
Create a report in HubSpot by starting with the management question, choosing the relevant CRM data source, applying the agreed filters, and selecting a visualization that makes the decision clear. Then add the report to a HubSpot dashboard, document its cutoff and definition, and test the total against record-level evidence.
A practical setup sequence is:
- Reuse an existing report when its definition fits. Do not create a new report merely to change a color or layout.
- Use the custom report builder for a defined gap. Choose the objects, properties, filters, frequency, and comparison before arranging the chart.
- Separate operational and management views. A sales team may need a live Sales Hub funnel and sales-performance dashboard, while management needs a fixed weekly or monthly comparison.
- Use specialized reports deliberately. Attribution reports can explain marketing influence, and customer journey reports can examine ordered touchpoints. Neither should be added unless it answers the current reporting need.
- Customize the dashboard for its audience. A marketer may focus on conversion rates and attribution. A sales manager may focus on pipeline, forecast, sales performance, and ROI. Keep the underlying definitions consistent.
- Validate before distribution. Confirm the filters, excluded records, currency rule, refresh time, and record totals before scheduling or exporting the report.
This is the difference between using HubSpot as an analytics tool and treating a dashboard as proof by itself. The report builder can organize data in HubSpot, but the reporting contract still governs what the numbers mean.
Copy-paste management report contract
Use this block at the top of every weekly or monthly pack:
Audience:
Decision this report supports:
Reporting period:
Data cutoff date and time:
Included pipelines and teams:
Excluded records:
Record grain:
Currency and conversion rule:
Revenue definition:
Forecast definition:
Pipeline definition:
KPI definition version:
Reconciliation status:
Known data limitations:
Report owner:
Next review date:
If the team cannot complete this contract, the first meeting should resolve definitions rather than debate performance.
The five blocks in a useful HubSpot management report
Keep the first page or executive summary limited to the five questions management actually needs to answer.
- Revenue versus target: Ask whether the business is on plan. Show actual, forecast, target, gap, and cutoff. End with either an intervention or an accepted outlook.
- Forecast and coverage: Ask whether the remaining target is covered. Show open pipeline, weighted pipeline, forecast categories, and coverage. End with a pipeline creation or conversion action.
- Pipeline movement: Ask what changed since the last review. Show the opening position, created and reopened deals, wins, losses, removals, and value changes. Explain every material movement.
- Pipeline health: Ask which risks make the forecast fragile. Show stale, overdue, ownerless, unmapped, and slipped deals. Assign a named owner to each remediation action.
- Drivers and segments: Ask why the result changed. Show win rate, deal size, sales cycle, source, team, and product. End with a focused operating change.
Do not add a chart because HubSpot can create it. Add a block only when it changes a decision or validates an action from the prior review.
For the detailed report menus, use the job-specific landing pages for sales pipeline reporting, revenue, forecast, goal, and ROI reporting, Service Hub performance reporting, and AEO reporting and export workflows.
Step 1: Fix the cutoff, scope, and grain
Start with the data contract, not the chart builder.
Choose one snapshot date and record it. Then define which pipelines, teams, deal types, currencies, and closed stages are included. State the grain explicitly, such as one deal per row per snapshot date. This prevents a company with three associated deals from being counted as one record in one report and three records in another.
For weekly comparisons, preserve both the prior and current state. HubSpot has useful stage history and stage calculated properties, including dates entered and exited and time in stage. These fields support movement and velocity analysis. They do not replace a fixed snapshot when the question is, “What did we believe last Monday compared with this Monday?”
The practical minimum export is:
| Field | Why it is needed |
|---|---|
| Deal ID | Stable key for matching snapshots |
| Deal name and company | Human review and exception ownership |
| Pipeline and deal stage | Scope, position, and movement |
| Deal owner | Accountability |
| Amount and currency | Pipeline and revenue calculations |
| Create date and close date | Age, period, and overdue checks |
| Last and next activity dates | Stale and no-next-step checks |
| Forecast category | Forecast scenario and mismatch checks |
| Deal type | New, expansion, renewal, or other segmentation |
| Closed won and closed lost | Outcome classification |
HubSpot’s default deal properties already cover much of this schema, including pipeline, stage, probability, forecast category, last activity, and closed outcomes. Your job is to make the local definitions and completion rules explicit.
Step 2: Define revenue, target, forecast, and coverage
The most expensive reporting mistake is mixing numbers that share a currency symbol but answer different questions.
Bookings, recognized revenue, ARR, MRR, ACV, TCV, forecast, and pipeline are not interchangeable. Put the chosen definition beside the number. If Amount is a bookings proxy, say so. If Finance owns recognized revenue in another system, do not rename a HubSpot deal total to make the slide look complete.
HubSpot supports goal reporting alongside deals. Its documentation also warns that goal reports should filter to one KPI unit type so incompatible units are not aggregated together. Apply the same discipline to currency and cadence. A quarterly target grouped monthly without an allocation rule creates a comparison that looks precise but is not defined.
Use these core calculations:
Target attainment = closed revenue to date / period target
Target gap = period target - closed revenue to date
Required run rate = max(0, target gap / remaining periods)
Weighted pipeline = sum(open deal amount * approved probability)
Coverage ratio = open pipeline / remaining target gap
Forecast gap = period target - forecast revenue
HubSpot’s forecast tool can use total amount or weighted amount and organize deals into forecast categories such as Pipeline, Best case, Commit, and Closed won. Decide which definition your management pack uses and keep it stable across periods.
For a full worked method, use the HubSpot revenue versus target report guide. For recurring revenue, use the existing HubSpot ARR, NRR, and GRR reporting guide rather than forcing retention metrics into this general management layer.
Step 3: Reconcile pipeline movement
Two pipeline totals do not explain a change. A bridge does.
Match the same deal_id across the prior and current snapshot, then classify each record:
- Created: absent before and open now.
- Reopened: closed before and open now.
- Won: open before and closed won now.
- Lost: open before and closed lost now.
- Removed: open before and absent now. Always investigate this.
- Expanded: open in both snapshots and amount increased.
- Contracted: open in both snapshots and amount decreased.
- Progressed or regressed: stage order moved forward or backward.
- Slipped: close date moved later beyond the agreed tolerance.
The monetary bridge is:
Closing open pipeline
= Opening open pipeline
+ Created
+ Reopened
+ Expansions
- Won
- Lost
- Removed
- Contractions
Stage progress and close-date slips explain the composition and risk of pipeline. They do not change its total value, so do not add them to the monetary reconciliation.
Any non-zero difference is a reporting exception, not a rounding detail. Find the unmatched record before presenting the movement. The HubSpot pipeline change report covers the report workflow, while the historical pipeline snapshot report explains the evidence needed for past-state comparisons.
Step 4: Put forecast fragility beside forecast value
A forecast can be numerically above target and still be operationally weak.
Pair every forecast with a short health block. Start with these twelve checks:
- Missing owner
- Missing or zero amount
- Missing close date
- Overdue close date
- No recent activity
- No next activity
- Excessive deal age
- Stage-age breach
- Regressed stage
- Close-date slip
- Forecast category mismatch
- Low target coverage
Do not turn the health section into a giant exception table. Show the count and value by check, then bring only the largest or newly material exceptions into the meeting. Every exception needs a remediation prompt, owner, and due date.
The stale deals report handles activity and overdue-date risk. The weekly deal aging report adds age and stage context. The deal velocity report helps determine whether slower movement is a pipeline-wide trend or a small number of stuck deals.
Step 5: Run a 30-minute management review
The reporting pack is only useful if the meeting produces decisions.
| Minute | Review item | Required output |
|---|---|---|
| 0 to 3 | Confirm cutoff and data quality | Accepted dataset or named blocker |
| 3 to 8 | Revenue, target, and forecast gap | One quantified gap statement |
| 8 to 15 | Pipeline bridge | Top three movements and explanations |
| 15 to 22 | Pipeline health exceptions | Owners and remediation dates |
| 22 to 27 | Coverage and next-period risks | Agreed interventions |
| 27 to 30 | Decisions and actions | Decision, owner, due date, evidence needed |
Use the same five-field commentary structure for every material variance:
Observation: What changed, by how much, and against which comparison?
Explanation: What operational event caused the change?
Evidence: Which report, deal set, or reconciled movement supports it?
Decision: What will the team do or accept?
Owner/date: Who owns it and when will it be checked?
Example using the fictional starter pack:
Observation: closing open pipeline fell by $155,000 week over week. Explanation: won, lost, and removed value exceeded newly created and reopened pipeline. Evidence: the bridge reconciles $1.510 million opening pipeline to $1.355 million closing pipeline with zero unexplained difference. Decision: inspect the removed deal and replace lost coverage. Owner/date: Sales director, next weekly review.
The numbers are fictional, but the structure is the point: one claim, one cause, one evidence trail, and one action.
What HubSpot can automate, and what still needs control
HubSpot can reduce recurring reporting work:
- Custom reports can refresh as new data becomes available.
- Reports and dashboards can be shared on recurring schedules.
- Eligible reports can export data in CSV or Excel formats.
- Goals can be reported alongside deals.
- Forecast categories and weighted amounts can support scenario views.
- Stage calculated properties can expose time and movement through a pipeline.
Automation does not decide the cutoff, fix an ambiguous KPI, reconcile a deleted deal, or write credible management commentary. Those are governance and operating responsibilities.
Use automation for repeated collection and distribution. Keep a review gate for definition changes, missing data, currency conversions, unmapped stages, and material narrative.
For the detailed export workflow, including when to use CSV, Excel, editable charts, or slides, see how to export HubSpot reports to Excel and PowerPoint. For the recurring operating cadence, use the HubSpot weekly sales report template. For the board narrative, use the seven-slide HubSpot board reporting template.
Download the complete reporting starter pack
The free HubSpot management reporting starter pack contains:
- A 13-sheet XLSX workbook with fictional sample data
- Fixed weekly snapshots and a reconciled pipeline bridge
- Revenue-versus-target, forecast, coverage, and driver calculations
- Twelve pipeline-health checks
- An 18-metric KPI dictionary
- A reporting QA checklist
- A 30-minute meeting agenda and action log
- Commentary prompts
- An editable eight-slide PPTX board deck with native charts and tables
The workbook uses conventional formulas without macros, Power Query, or external links. It is designed for current Excel and Google Sheets imports. The deck is designed for current PowerPoint and Google Slides imports. Review formulas, formatting, and charts after any import.
Download the complete starter pack and run the QA checklist before using the sample as a live management report.
Frequently Asked Questions
What is HubSpot management reporting?
It is a repeatable decision pack built from HubSpot CRM data. A useful pack combines a fixed cutoff, governed KPI definitions, revenue and pipeline analysis, data-quality checks, commentary, and named actions.
Can HubSpot automate monthly management reports?
HubSpot can refresh custom reports, schedule dashboard emails, and export data. Management reporting still needs fixed cutoffs, reconciliation, definitions, and evidence-backed commentary so the pack remains comparable.
Which HubSpot reports should management review every week?
Start with revenue versus target, forecast and coverage, pipeline movement, pipeline health exceptions, and drivers such as win rate, deal size, and sales cycle. Add more only when a current decision needs them.
How do I compare HubSpot pipeline week over week?
Preserve two fixed snapshots, match deals by ID, classify value entering and leaving the open pipeline, and reconcile opening to closing value. Treat any difference as an exception to resolve.
Should I use live dashboards or exported data?
Use both for different purposes. Live dashboards support daily operations. Fixed exports or snapshots preserve the evidence used in a management decision and allow a like-for-like comparison later.
Can I export HubSpot reports to Excel and PowerPoint?
HubSpot supports CSV and Excel export for eligible report types and image export for reports. A fully editable PowerPoint management pack normally requires a separate deck workflow.
How often should management reporting run?
Run pipeline movement and health weekly, a fuller management pack monthly, and a board summary at the board cadence. Keep the definition and cutoff controls consistent across all three.
What should happen after the report is reviewed?
Every material variance should end with a decision, named owner, due date, and evidence required for the next review. If it does not, the report informed the room but did not manage the business.
SWOTBee builds reporting around the decision your team needs to make, then fixes the HubSpot data and workflow beneath it.