This branch is part of HubSpot Management Reporting: A Practical System for 2026.
You can build an actual-revenue-versus-target report in HubSpot by using Goals as the primary data source, Deals as the secondary source, and plotting goal target beside closed deal amount at the same time cadence. The chart becomes management-ready only after you also define the revenue basis, calculate the remaining gap and required run rate, show forecast separately, and test whether open pipeline covers the gap.
Copy the revenue-versus-target worksheet and editable board chart from the free starter pack.
Before you build the report, define revenue
A chart can be mathematically correct and still compare the wrong things.
Choose the basis first:
| Candidate measure | What it normally represents | Main reporting risk |
|---|---|---|
| Closed deal amount | Booked value on won deals | May not equal recognized revenue |
| ARR | Annualized recurring value | Can be wrong when terms or line items are inconsistent |
| ACV | Annual contract value | May exclude one-time fees or multi-year structure |
| TCV | Total contract value | Overstates one-period performance when the contract spans years |
| Recognized revenue | Finance-led accounting measure | Often belongs in ERP or accounting data, not the CRM deal |
Write the selected measure in the report title and definition. State the currency, period, included pipelines, closed-won stages, and whether refunds, cancellations, tax, or services are excluded.
If the annual target came from Finance but the actual comes from HubSpot deal amount, reconcile the two definitions before the report reaches leadership. Do not rename bookings as revenue because the chart needs a shorter label. For the broader governance pattern, return to the management reporting pillar.
Build the native HubSpot revenue vs target report
HubSpot’s current documentation provides a direct custom-report method for monthly closed-won revenue against monthly revenue targets.
1. Create the report from Goals
In HubSpot, go to Reporting > Goals, choose Create report, then select the custom report builder. Use:
- Primary data source: Goals
- Secondary data source: Deals
- Goal fields: Goal target, goal progress, KPI unit type, goal name, owner or team, start date, end date
- Deal fields: Closed deal amount in home currency, close date, pipeline, stage, owner or team
Goals associate directly with deals. Other CRM objects can only join through deals, so keep this report narrow unless another source is essential to the decision.
2. Filter the KPI unit type and goal
Add these filters before configuring the chart:
KPI unit type = Currency
Goal name = [the approved revenue goal]
Pipeline = [the pipelines included in the target]
Deal stage = Closed won stages only
Close date = [the reporting period]
The KPI unit filter is not cosmetic. HubSpot warns that without it, values from currency, number, duration, or decimal goals can be aggregated together. Also select the intended goal rather than allowing unrelated goals to roll into one target.
3. Match the goal cadence
If the target is monthly, group by month. If it is quarterly, use a quarterly view or document how the quarterly target is allocated into months. Do not compare a full-quarter target with one month of actual revenue and call the result attainment.
Use goal End datetime or the agreed period field on the x-axis. Place Goal target and Closed deal amount in home currency on the y-axis. A vertical bar, line, or area chart makes the comparison easy to read.
HubSpot also provides quota-attainment reporting in the sales analytics suite. That is useful when the question is rep or team attainment. The custom goals-plus-deals report is more flexible when the management question needs a specific pipeline, period, or goal definition.
Add the five calculations management needs
The native chart answers, “How much closed against the goal?” Management usually needs five related calculations.
Attainment = closed revenue to date / period target

Current target gap = max(0, period target - closed revenue to date)

Required revenue per remaining period
= current target gap / remaining periods

Forecast variance = forecast revenue - period target

Pipeline coverage = open pipeline / current target gap
Keep actual, forecast, and pipeline visibly separate:
- Actual is achieved performance under the approved closed-revenue definition.
- Forecast is the expected outcome from defined categories, probabilities, or submissions.
- Pipeline is the open opportunity set that may support the remaining target.
HubSpot’s forecast tool can use total amount or weighted amount. Weighted amount is deal amount multiplied by probability. Neither is a substitute for closed actual revenue.
Worked example from the starter pack
The fictional company in the workbook uses deal amount as a bookings proxy. It is not a claim about recognized revenue, ARR, or TCV.
| Measure | Value | Calculation or interpretation |
|---|---|---|
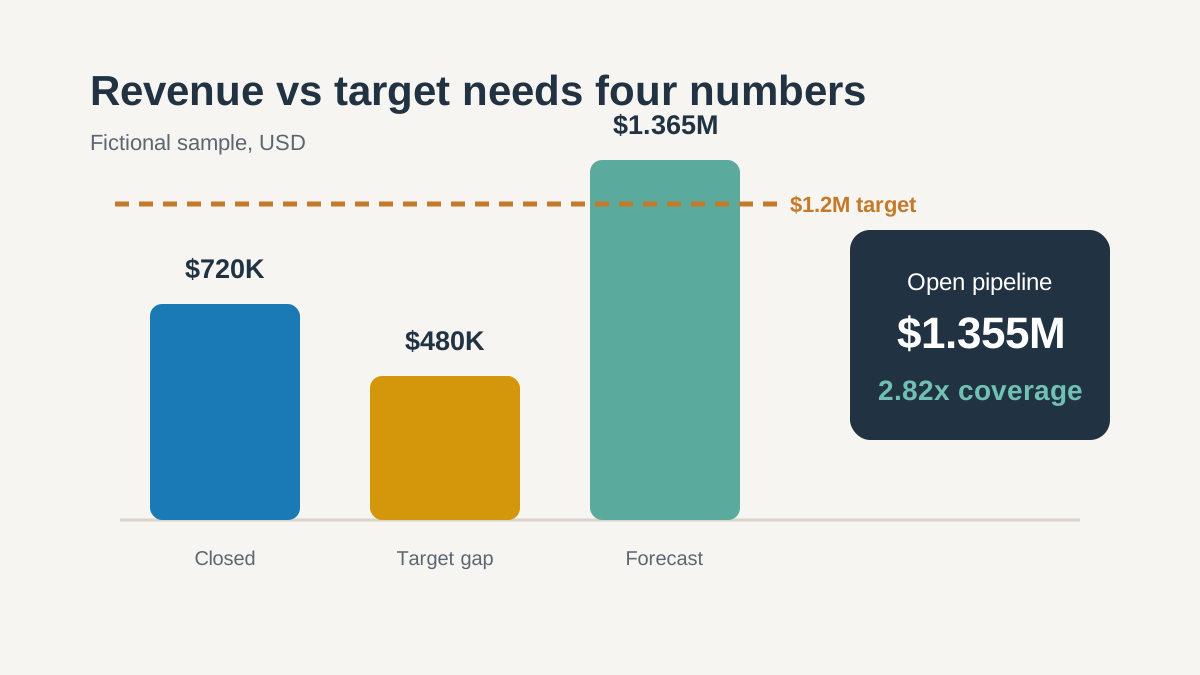
| Annual target | $1,200,000 | Approved target |
| Closed revenue to date | $720,000 | Fictional closed-won bookings proxy |
| Attainment | 60% | $720,000 / $1,200,000 |
| Current target gap | $480,000 | $1,200,000 - $720,000 |
| Remaining periods | 3 | Workbook input |
| Required per period | $160,000 | $480,000 / 3 |
| Forecast revenue | $1,365,000 | Closed actual plus defined forecast categories |
| Forecast variance | $165,000 above target | $1,365,000 - $1,200,000 |
| Open pipeline | $1,355,000 | Open deals at the fixed cutoff |
| Coverage | 2.82x | $1,355,000 / $480,000 |
The correct management statement is not simply, “Forecast is above target.”
Use the five-field commentary structure:
Observation: Forecast is $165,000 above the $1.2 million target.
Explanation: Defined forecast categories add $645,000 to $720,000 closed to date.
Evidence: The fixed-cutoff forecast table and 2.82x open-pipeline coverage.
Decision: Validate the largest commit deals and replace coverage lost to slips.
Owner/date: Sales director, next weekly review.
The workbook also flags that four close-date slips make the apparently positive outlook fragile. That is why a forecast result needs pipeline-health evidence beside it.
Avoid the six common target-report errors
Mixing goal unit types
Filter to Currency. Do not aggregate a revenue goal with a deal-count or activity goal.
Combining unrelated goals
Filter by the intended goal name, owner or team, and period. Otherwise different targets can inflate the total.
Mismatching goal and report cadence
Monthly actuals need monthly targets. If leadership approved an annual target, document the allocation method before showing monthly pace.
Comparing different pipeline scopes
If the target covers New Business and Expansion but the report includes Renewals or excludes one regional pipeline, the variance is not meaningful.
Mixing currencies
Use company currency or an approved conversion rule. Record whether closed and open deals use the same exchange-rate basis.
Treating forecast as achieved revenue
Show forecast as a separate outlook. A positive forecast variance can disappear through loss, slippage, amount reduction, or data cleanup.
The broader revenue, forecast, goal, and ROI reporting page maps the other HubSpot reports that support this decision.
When the audience is the board, carry these same governed totals into the seven-slide HubSpot board report template rather than rebuilding the definitions in a separate deck.
Turn the report into a weekly decision
Use this short sequence in the management meeting:
- Confirm the cutoff, revenue definition, currency, and included pipelines.
- State actual attainment and current target gap.
- State the required revenue per remaining period.
- Compare forecast with target without relabeling forecast as actual.
- Test coverage against historical win rate, time remaining, and deal mix.
- Name the deals or segments that explain the variance.
- Record the intervention, owner, due date, and evidence for the next review.
For recurring revenue targets, use the HubSpot ARR, NRR, and GRR reporting guide. For target definitions affected by contract value, read TCV versus ARR forecasting before choosing the amount field.
Frequently Asked Questions
Can HubSpot report actual revenue against a target?
Yes. Use Goals as the primary data source and Deals as the secondary source, then plot goal target beside closed deal amount at the same cadence.
Why is my HubSpot goal report total wrong?
Check for mixed KPI unit types, multiple goals, cadence mismatch, wrong pipeline scope, duplicate team and user goals, and a revenue field that does not match the target definition.
What is target attainment?
Target attainment is closed revenue to date divided by the period target. Multiply by 100 for a percentage.
How do I calculate required revenue per remaining month?
Subtract closed revenue from target, floor the gap at zero, and divide by remaining months. Use a fixed cutoff so the calculation remains reproducible.
Should forecast count as actual?
No. Actual is achieved closed performance. Forecast is an outlook based on open deals, categories, probabilities, or submissions.
What is pipeline coverage?
Coverage is open pipeline divided by the remaining target gap. Treat the threshold as a hypothesis to validate against historical win rate, cycle length, deal mix, and time remaining.
The free HubSpot management reporting starter pack includes this worksheet, its verified fictional example, the KPI dictionary, QA checklist, and an editable board slide.
SWOTBee helps teams make the target, forecast, pipeline, and underlying HubSpot definitions agree before leadership relies on the result.