This branch is part of HubSpot Management Reporting: A Practical System for 2026.
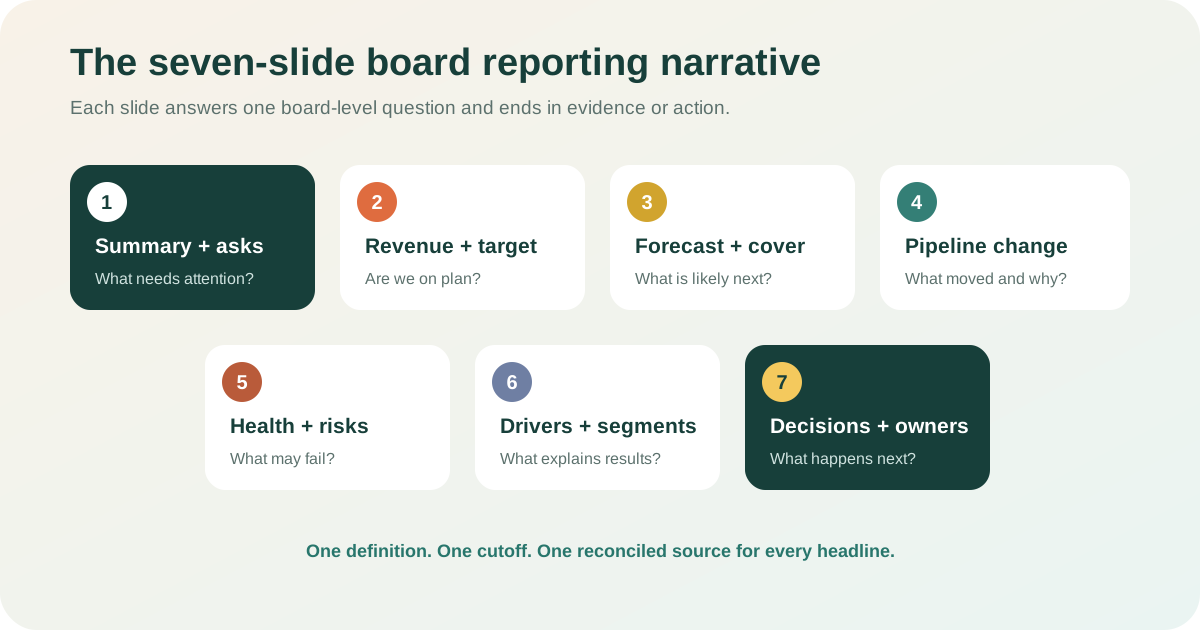
A strong HubSpot board report is a short decision narrative, not a dashboard screenshot collection. Use seven slides to show what happened, why it happened, what is likely next, which risks matter, and what guidance or approval the board needs.
Download the editable seven-slide PowerPoint and its reconciled Excel source. The pack contains fictional data so you can understand the model before replacing inputs.
Why this is not the weekly sales deck
The weekly sales report template helps managers run a fixed-cutoff operating meeting. It names deals, resolves exceptions, and assigns actions for the next week.
A board report has a different job:
- summarize performance over the approved board period
- compare actual results with plan and prior outlook
- explain material variance with evidence
- show the forward revenue and pipeline outlook
- distinguish operating noise from strategic risk
- request a decision, approval, or guidance where appropriate
The board pack should not hide material detail, but it should move deal lists, field definitions, reconciliation logs, and diagnostic tables into an appendix. Each core slide needs one message.
Start with company stage and the board ask
Current HubSpot board-template material separates metrics by growth stage. That is the right principle: a pre-revenue company should not copy a growth-stage scorecard without adaptation.
| Company stage | Likely board focus | Supporting HubSpot evidence |
|---|---|---|
| Pre-revenue | qualified opportunities, customer learning, time to next proof point | stage progression, meeting outcomes, named opportunities |
| Product-market fit search | retention signals, ICP learning, early repeatability | segment conversion, loss reasons, customer and deal evidence |
| Go-to-market fit | pipeline creation, unit economics, conversion, capacity | source, stage, owner, amount, cycle, outcome |
| Growth | target attainment, forecast, coverage, efficiency, segment mix | goals, closed results, forecast categories, pipeline and cohorts |
Before building slides, complete one sentence:
At this meeting, the board should understand [material result and outlook]
and decide or advise on [specific ask].
If there is no ask, the pack can still confirm oversight, but it should state which risks, assumptions, or milestones directors are expected to challenge.
Lock the board reporting contract
Every headline needs a definition the finance, sales, and executive teams can trace.
Record:
- reporting period and data cutoff
- currency and conversion method
- included business units, pipelines, products, and regions
- revenue basis: bookings, recognized revenue, ARR, ACV, TCV, or another measure
- plan and target source
- actual and forecast rules
- cohort rules for win rate and cycle time
- comparison period and prior forecast version
- source owner, calculation owner, and approver
HubSpot deal amount can support a bookings view. It is not automatically recognized revenue. Reconcile CRM values to the finance-approved measure before using a revenue label in a board pack.
The HubSpot revenue versus target guide provides the formula and governance detail behind the main performance slide.
The seven-slide HubSpot board report
Slide 1: Executive summary and board asks
Answer four questions:
- What is the headline performance result?
- What materially changed from plan or prior outlook?
- What is the forward view?
- What decision or guidance is requested?
Use no more than three headline messages. Each should combine a result, its meaning, and the next action.
Result: Closed bookings are 60% of the $1.2M annual target.
Outlook: Defined forecast is $1.365M, but four close-date slips weaken confidence.
Ask: Confirm whether hiring remains gated on the next two enterprise milestones.
The numbers are fictional template values, not customer results.
Slide 2: Actual revenue and forecast versus target
Show actual, target, current gap, required run rate, forecast, and forecast variance. Keep actual and forecast visually separate.
| Measure | Fictional value | Meaning |
|---|---|---|
| Target | $1,200,000 | Approved period target |
| Closed actual | $720,000 | Defined closed-won bookings proxy |
| Attainment | 60% | Actual divided by target |
| Remaining actual gap | $480,000 | Target minus actual |
| Forecast | $1,365,000 | Actual plus approved forecast categories |
| Forecast variance | $165,000 above target | Forecast minus target |
State the revenue basis beside the chart. A positive forecast variance is an outlook, not achieved performance.
Slide 3: Forecast and pipeline coverage
Show how the forecast is composed and whether eligible open pipeline covers the remaining actual gap.
Coverage = eligible open pipeline / remaining actual gapCoverage is contextual. A 3x ratio can be weak when historical win rate is 15%, cycles are long, and little time remains. A lower ratio can be sufficient for a high-conversion renewal motion. Show the relevant history and do not present one threshold as universal.
Name the top assumptions beneath the chart: large commits, forecast-category changes, concentration, slips, and missing submissions.
Slide 4: Pipeline movement
A stage chart shows current composition. A bridge explains how the pipeline changed.
Use the same cutoff and scope at both dates:
Closing pipeline
= Opening pipeline
+ New and reopened
+ Amount increases
- Won
- Lost
- Removed
- Amount reductions
Include close-date pull-ins and push-outs as timing evidence. Reconcile the net change to named deals. The pipeline change dashboard contains the detailed movement job that supports this slide.
Slide 5: Pipeline health and material risks
Show only risks that can change the forecast or strategic decision:
- stale or overdue high-value deals
- missing next steps or accountable owners
- repeated close-date push-outs
- stage and forecast-category mismatch
- excessive value concentration
- unsupported probability or amount
- data-quality exceptions affecting the headline
For each risk, show exposure, evidence, mitigation, owner, and next milestone. Use the pipeline health dashboard for the operating detail.
Slide 6: Drivers and segments
Explain the result, not just the total. Choose two or three dimensions that can support action:
- new business versus expansion
- product or service line
- region or market
- source or channel
- customer segment
- sales team or capacity cohort
- opportunity count, deal size, win rate, or cycle time
Avoid misleading cohort comparisons. The survivorship-bias reporting guide explains why changing denominators or excluding losses can make performance appear stronger than it is.
Slide 7: Decisions, owners, and next review
End with the consequence of the analysis.
Use a compact decision register:
- Validate the two largest commit deals. Evidence: forecast concentration and slip history. Owner: Sales director. Due: next Friday. Status: open.
- Resolve the revenue-definition difference. Evidence: CRM bookings versus the finance measure. Owners: CFO and RevOps. Due: before pack approval. Status: open.
- Confirm the hiring gate. Evidence: base and downside coverage. Owner: CEO. Due: board meeting. Status: decision needed.
Separate management actions from board asks. Directors should not have to infer which item needs their approval.
Build the deck from reconciled outputs
HubSpot’s current sharing workflow supports report data exports and report images. It does not describe a native editable board PowerPoint export. Use report images only as evidence or appendix material.
For editable output:
- Export the required HubSpot fields using an auditable cutoff.
- Load source rows into a protected raw-data layer.
- Calculate KPIs, comparisons, and QA tests in a governed model.
- Reconcile source, workbook, and slide headline totals.
- Drive each slide chart from a named output range.
- Add narrative, risks, asks, owners, and caveats.
- Archive the source export, workbook, and final deck together.
The detailed Excel and PowerPoint export guide provides the controlled refresh sequence.
Use this final equality:
Approved source total = workbook total = chart total = slide headlineIf the equality fails, mark the slide provisional and resolve it before distribution.
Add commentary directors can challenge
Use one compact block per material slide:
Observation: What changed versus plan or prior outlook?
Explanation: Which operating driver caused it?
Evidence: Which reconciled totals and records support the explanation?
Implication: What changes in the forward view?
Decision: What action, approval, or guidance is required?
Owner/date: Who acts, and when is the result reviewed?
State confidence and caveats explicitly. Do not turn a model output into certainty. If forecast depends on two unusually large deals, say so beside the forecast.
Run a board-pack challenge review
Before approval, assign someone who did not build the deck to test it.
Check:
- Does each slide have one message?
- Does every headline specify the correct metric basis and period?
- Do actual, forecast, and pipeline remain separate?
- Can every material variance be traced to evidence?
- Are comparisons based on consistent cohorts and cutoffs?
- Are risks quantified rather than described vaguely?
- Are board asks explicit?
- Are management actions assigned to named owners?
- Does the appendix contain definitions and reconciliation support?
- Would a director understand what changed without opening HubSpot?
Copy the seven-slide deck, workbook, QA checklist, and commentary prompts. Replace fictional inputs only after completing the reporting contract.
Connect the board view to recurring reporting
The board deck should be the compressed output of the same governed system used by management. Do not rebuild definitions exclusively for the quarterly meeting.
Use the revenue, forecast, goal, and ROI reporting page for the revenue reporting path and the sales and pipeline reporting page for the operating pipeline path.
The board view should preserve the same cutoff, definitions, evidence, and ownership as the recurring reports. What changes is the level of detail and the decision horizon.