This branch is part of HubSpot Management Reporting: A Practical System for 2026.
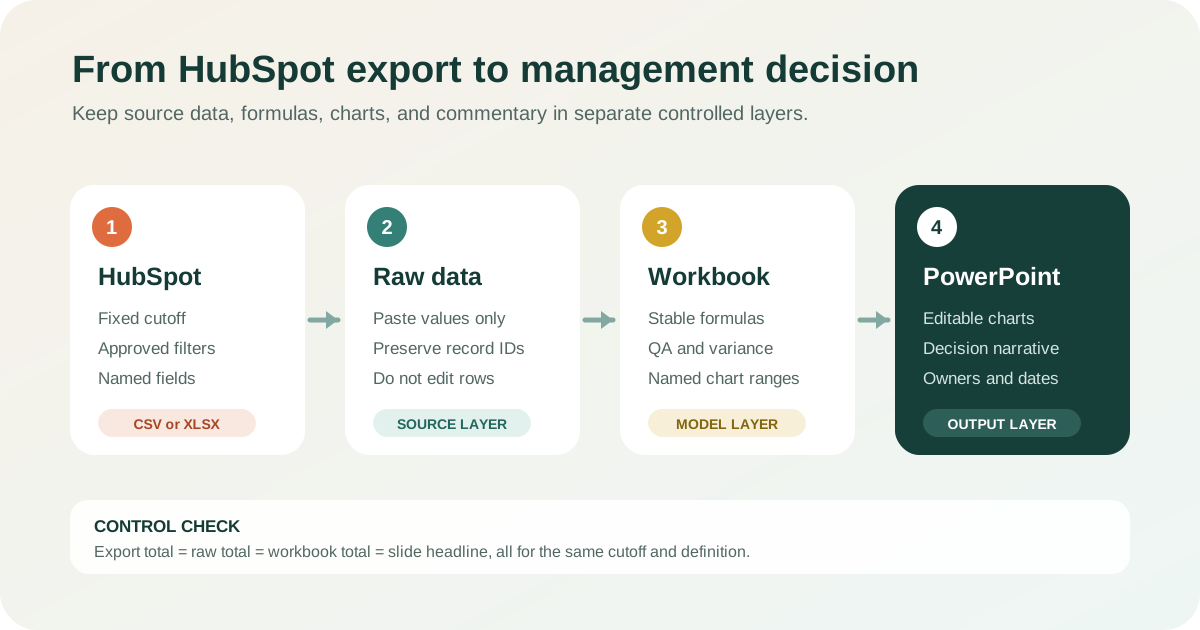
HubSpot can export report data to CSV or Excel and can export a report as an image, but its current reporting documentation does not describe a native editable PowerPoint export. The reliable workflow is to export governed data, load it into a stable workbook, reconcile the totals, and refresh an editable presentation template from named chart ranges.
Download the Excel reporting model and editable seven-slide PowerPoint before following the workflow.
Can HubSpot export reports to Excel?
Yes. HubSpot’s current documentation says a report can be exported as CSV or Excel. In the custom report builder, fields added to the report configuration become columns in the export. Single-object reports similarly export the properties selected on the Data tab.
That detail matters. An Excel file is not automatically a complete extract of every property on every matching record. If the management model requires deal ID, owner, amount, stage, pipeline, create date, close date, forecast category, next activity, and currency, add those fields before exporting.
Use this pre-export contract:
| Control | Recorded value and purpose |
|---|---|
| Cutoff | Friday 17:00 UTC, so weeks remain comparable |
| Date range | Current quarter, not an unnoticed rolling window |
| Date field | Close date, so create-date totals are not mixed in |
| Scope | New Business and Expansion, aligned with the target |
| Currency | Company currency, preventing mixed-currency addition |
| Closed rule | Approved closed-won stages, defining actual performance |
| Export fields | Record ID plus model inputs, preserving joins and auditability |
| Owner | Revenue operations manager, making exceptions actionable |
Name the file so another person can identify it without opening it:
hubspot_deals_2026-Q3_cutoff-2026-09-24T1700-Europe-London.xlsxDo not overwrite last week’s source file. Historical exports are evidence of what the CRM contained at each cutoff, especially when properties can later change.
Can HubSpot schedule recurring report emails?
Yes, within the rules of the selected report, dashboard, subscription, permissions, and recipient type. HubSpot documents daily, weekly, and monthly recurring report emails. It also supports dashboard email schedules and sharing through Slack or Google Chat in supported configurations.
Two details deserve an operating note:
- HubSpot says report data for a scheduled email is captured two hours before the configured delivery time.
- Some report types do not support data attachments or recurring delivery, including configurations identified in HubSpot’s current sharing documentation.
Therefore, write the effective data cutoff in the report itself. A Monday 09:00 email may not represent the CRM state at exactly 09:00.
Scheduling solves distribution. It does not automatically create a consistent comparison, preserve last week’s state, explain a variance, or assign a decision. Those jobs belong in the reporting workflow.
Why an export is not yet a management report
An export is a source dataset. A management report is a decision package.
The source dataset answers questions such as:
- Which deals matched the report filters?
- What properties did those records contain at the cutoff?
- What was the exported amount or count?
The management pack must also answer:
- What changed from the previous cutoff?
- Which definition produced the headline KPI?
- Which records explain the movement?
- What risk or opportunity follows?
- What decision is required, who owns it, and by when?
That is why the broader management reporting system separates source data, governed calculations, commentary, and decisions.
Map exported fields into a stable workbook
Use four layers. Do not place raw data, formulas, manually typed commentary, and slide-ready charts on one worksheet.
1. Control sheet
Record the report contract:
Reporting period: 2026 Q3
Data cutoff: 2026-09-24 17:00 Europe/London
Currency: USD company currency
Pipelines: New Business, Expansion
Actual: Closed-won deal amount by close date
Forecast: Closed actual plus approved forecast categories
Comparison: Previous Friday at the same local time
Owner: Revenue Operations
2. Raw-data sheet
Convert the imported rows into an Excel Table called DealsRaw. Keep the exported headers stable and preserve HubSpot record IDs. Do not manually fix amounts, owners, or stages here. Correct the CRM or record an explicit transformation in the model.
Add a source-control box above the table:
Source file
Export timestamp
Row count
Sum of amount
Minimum and maximum close date
Imported by
3. Model sheets
Calculate KPIs away from the raw rows. For example:
Closed revenue = SUMIFS(DealsRaw[Amount], DealsRaw[Stage], "Closed won")

Open pipeline = SUMIFS(DealsRaw[Amount], DealsRaw[Status], "Open")

Coverage = Open pipeline / Remaining target gap

Absolute variance = Current period - Previous period

Percentage variance = IFERROR(Absolute variance / Previous period, "N/A")
Your actual formula will use the approved stage and currency columns. The important design rule is that the calculation references the structured raw table, not a fragile fixed range such as D2:D843.
4. Output sheets
Create small, named ranges for slide-ready tables and charts. A slide chart should never depend directly on an entire raw-data column. Use a controlled output range such as RevenueBridge_Output or PipelineMovement_Output that contains only reconciled values and labels.
Preserve formulas, definitions, and comparisons
A repeatable workbook keeps the model fixed while the source rows change.
Use this refresh sequence:
- Save the prior workbook and export in a dated archive folder.
- Copy current values into the previous-period layer before replacing the source.
- Load the new export into the raw-data table without renaming columns.
- Confirm the row count and source total.
- Refresh queries, pivots, formulas, and charts.
- Review every error, blank owner, missing date, and unmapped stage.
- Reconcile headline totals back to HubSpot for the same cutoff.
- Freeze the final workbook version used by the presentation.
Use a QA table that fails visibly:
| Test | Expected result | Escalate when |
|---|---|---|
| HubSpot total minus raw total | $0 | Any non-zero difference |
| Raw total minus model total | $0 | Any non-zero difference |
| Missing record ID | 0 | Any row is untraceable |
| Missing owner on open deal | 0 | Accountability is absent |
| Closed won without close date | 0 | Period assignment is invalid |
| Unknown pipeline or stage | 0 | The mapping does not cover the CRM |
| Slide headline minus model output | $0 | Presentation is stale or edited |
If the source is large, use Power Query or another controlled import rather than manual copy and paste. Keep the same separation: source, transformation, model, output.
Build a seven-slide PowerPoint without copying screenshots
HubSpot can export a report as an image, which is useful for evidence or an appendix. A screenshot should not be the main management chart when the audience needs editable labels, comparisons, annotations, and a consistent visual hierarchy.
Build these seven slides:
- Executive summary: three headline results, material changes, and decisions needed.
- Actual and forecast versus target: actual, forecast, target, gap, required run rate, and coverage.
- Pipeline change bridge: opening pipeline, created, increased, decreased, pulled in, pushed out, won, lost, and closing pipeline.
- Conversion and velocity: stage conversion, win rate, cycle time, and the four sales-velocity drivers.
- Risks and exceptions: named stale deals, slips, losses, unsupported amounts, and data-quality failures.
- Outlook and scenarios: base, upside, and downside assumptions with explicit evidence.
- Decisions and owners: decision, owner, deadline, status, and next review date.
For each slide, keep the headline tied to one workbook output cell and the chart tied to one named output range. Then add commentary using this structure:
Observation: What changed?
Explanation: Why did it change?
Evidence: Which records and reconciled totals support the explanation?
Decision: What should happen next?
Owner/date: Who acts, and when is it reviewed?
The free starter pack already contains this workbook structure and editable deck. Copy the export map and seven-slide presentation template, then replace only the fictional inputs after completing the control sheet.
Keep detailed exports as supporting evidence
Do not place every exported row on a slide. Archive detailed exports and expose only the exceptions relevant to the decision.
Keep these as supporting detail:
- complete deal-level export with record IDs
- field and filter definition sheet
- currency conversion assumptions
- stage and forecast-category mappings
- data-quality exception list
- prior cutoff export
- reconciliation log
- image exports used as visual evidence
Be especially careful with funnel reports. HubSpot’s current export guidance notes that a funnel visualization can represent objects changing stages within the selected range while its exported file can contain objects created in that range. Validate what the chart and file each mean before reconciling them.
Apply the workflow to each reporting job
The same controlled export pattern works across teams, but each job needs its own governed fields and model:
- Sales and pipeline reporting needs deal movement, conversion, velocity, forecast, and named exceptions.
- Revenue, target, and ROI reporting needs actuals, goals, forecast categories, attribution rules, and currency controls.
- Service Hub performance reporting needs ticket volume, backlog, SLA, response, resolution, CSAT, and team ownership.
- AEO reporting and export workflows need prompt, citation, competitor, engine, topic, and observation-date fields.
Do not combine unlike definitions simply because all four outputs fit in Excel. Each model needs a declared grain, owner, cutoff, and source contract.
When should you automate the workflow?
Keep the governed workbook and deck manual while the metric definitions are still changing. Automating an unstable report only produces inconsistent results faster.
Automation becomes worthwhile when:
- the same exports are pulled on a fixed schedule
- the same joins and formulas are repeated
- refresh effort regularly delays the review
- manual copy and paste creates errors
- several teams need identical definitions
- historical snapshots must be preserved
- management needs editable outputs more frequently
Use this decision rule:
| Situation | Best next step |
|---|---|
| First two reporting cycles | Run the template manually and stabilize definitions |
| Stable report, small dataset | Use Excel Tables, named ranges, and a controlled refresh checklist |
| Repeated imports and transformations | Add Power Query or a governed data pipeline |
| Multiple teams and frequent outputs | Automate source capture, reconciliation, workbook, and presentation generation |
| Metric disputes remain unresolved | Stop and fix governance before automating |
The template proves the reporting contract. Automation should remove repeated collection, comparison, calculation, and presentation work without hiding how the totals were produced.
Use the weekly sales report template for the operating cadence, or the seven-slide board report template for the executive narrative. Both should use the same reconciled workbook outputs.
For an editable recurring output rather than another screenshot pack, review the reporting paths above and choose the team workflow that matches the decision. The result should still satisfy one final control:
HubSpot total = raw export total = workbook headline = slide headlineIf that equality fails, do not present the deck as final.