This article is part of our guide to SaaS renewal metrics.
Survivorship bias in NRR reporting happens when the customers left in the analysis look healthier because weaker customers have already disappeared. Aggregate retention or net revenue retention can rise while the business loses customers, becomes more dependent on a few accounts, and carries more forecast risk.
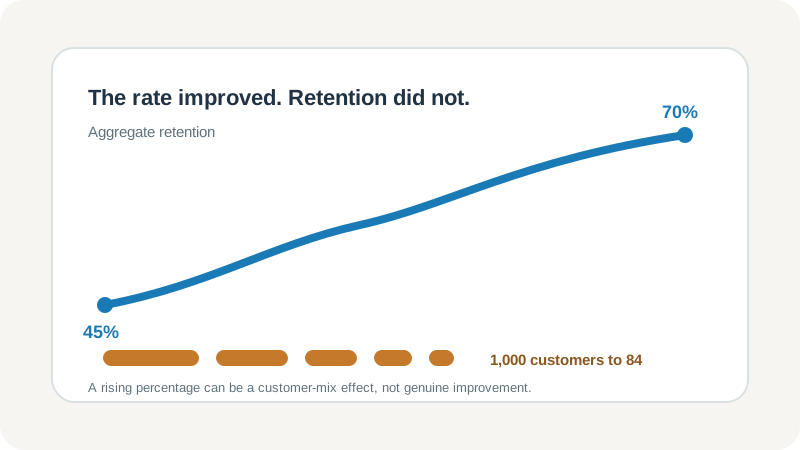
That is the CFO reporting trap: the rate improved, but retention did not. Before an NRR trend reaches a QBR or board deck, reconcile it with gross versus net revenue retention, logo retention, customer cohorts, and expansion concentration.
Can retention improve while the customer base collapses?
Yes. An aggregate retention rate can climb simply because low-retention customers leave faster, causing high-retention customers to dominate a smaller remaining base. No customer’s probability of staying needs to improve for the reported percentage to rise.
The clearest demonstration comes from the Marketing Science Institute working paper In Pursuit of Enhanced Customer Retention Management. Its example begins with two equally sized groups:
- 500 “good” customers, each with a constant 70% retention probability
- 500 “bad” customers, each with a constant 20% retention probability
Neither probability changes. Yet the aggregate retention rate rises as the weaker group leaves the population:
| Renewal period | Customers at start | Customers retained | Aggregate retention |
|---|---|---|---|
| 0 | 1,000 | 450 | 45% |
| 1 | 450 | 265 | 59% |
| 2 | 265 | 176 | 66% |
| 3 | 176 | 121 | 69% |
| 4 | 121 | 84 | 70% |
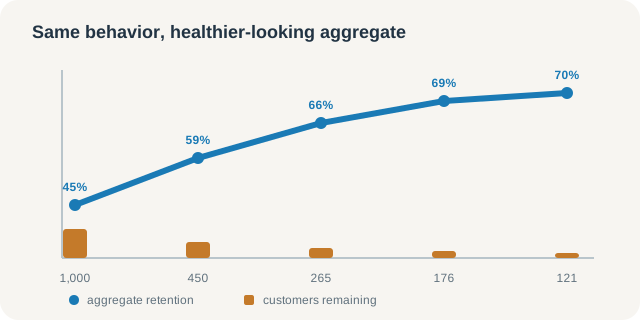
By the fifth observation, the headline rate has improved from 45% to 70%, while only 84 of the original 1,000 customers remain. The calculation is not showing better treatment, service, or product value. It is showing a sorting effect.
The example concerns customer retention, not SaaS NRR. Applying its mechanism to NRR is an operational inference, not a result claimed by the paper. That distinction matters because NRR introduces revenue weighting and expansion, which can create an additional masking effect.
What is survivorship bias in customer retention?
Survivorship bias in retention reporting is the overrepresentation of customers who remain. It can enter through an incorrect denominator, or it can appear as a genuine customer-mix shift even when the calculation itself is technically correct.
Three related problems should be separated:
- Survivor-biased calculation. An analyst starts with today’s active customers and looks backward. Customers that churned are missing, so the historical rate is overstated.
- Survivor mix shift. The analyst uses the right population, but low-retention groups leave faster. The aggregate rate rises because the base is now composed of stickier customers.
- Expansion masking. NRR is calculated correctly, but expansion from a few surviving accounts offsets churn and contraction elsewhere.
Fader and Hardie’s research on customer-base valuation in contractual settings explains why ignoring customer heterogeneity is dangerous. When customers have different underlying retention probabilities, the composition of the surviving base changes over time. A smooth aggregate curve can therefore misstate both future customer counts and customer-base value.
This does not mean every rising retention curve is misleading. If comparable cohorts or segments improve at the same tenure, that is evidence of better underlying performance. The control question is whether behavior improved within a stable population or whether the population changed.
How does the wrong NRR denominator make churn disappear?
The correct NRR denominator is the recurring revenue of a fixed customer cohort at the beginning of the period. Compare that same population at the end, count churned customers as zero, and exclude revenue from customers acquired during the period.
The cohort formula is:
NRR = (Starting ARR - churn - contraction + expansion) / Starting ARR x 100The SaaS Metrics Standards Board NRR standard describes the cohort method as normally the most accurate approach because both snapshots refer to the same beginning customer group. Balderton Capital’s SaaS metrics guide makes the same practical recommendation and warns against survivor-biased comparisons.
A report becomes survivor-biased when it asks, “How much did today’s customers spend last year?” That question silently removes every customer who left. The correct question is, “What happened to every customer and dollar present at the start?”
Contractual renewal rates need a second denominator rule: include only contracts that were actually due to renew in the period. The at-bat renewal-rate method prevents long-term contracts that faced no renewal decision from flattering the result.
For implementation, build NRR and GRR dashboards in HubSpot from frozen beginning-cohort snapshots, not a live list of current customers.
Can correctly calculated NRR still mislead executives?
Yes. Correct NRR answers whether recurring revenue from a starting cohort grew or shrank after churn, contraction, and expansion. It does not answer how many customers left, how concentrated the expansion was, or whether the surviving base became riskier.
Consider a deliberately simplified SaaS extension of the MSI mechanism. Suppose 121 equal-sized customers begin the year and only 84 remain. Logo retention is about 69%. If each survivor expands recurring revenue by 50%, the ending cohort produces 126 revenue units against 121 starting units:
Logo retention = 84 / 121 = 69.4%
NRR = (84 x 1.5) / 121 = 104.1%
The board sees NRR above 100%. The operating reality is that roughly 31% of logos disappeared. If the expansion is concentrated in five large accounts, the company may also have more revenue concentration and renewal exposure than it had a year earlier.
This is why NRR must be paired with GRR and logo retention:
| Metric | What it reveals | What it can hide |
|---|---|---|
| NRR | Revenue kept and expanded from the starting cohort | Logo loss and concentrated expansion |
| GRR | Revenue preserved before expansion | Customer-count loss among smaller accounts |
| Logo retention | Share of starting customers still present | Revenue weighting and account size |
| Cohort retention | Change by acquisition period, tenure, or segment | Small-sample volatility |
| Expansion concentration | Dependence on a few accounts for growth | Broad retention quality |
ChartMogul’s retention analysis of more than 2,500 SaaS businesses shows that NRR varies with ARR, average revenue per account, subscriber count, and customer tenure. That variation is precisely why one company-wide percentage needs segment and cohort context.
What should a CFO require in every retention report?
A CFO should require a retention bridge that reconciles a fixed starting customer and ARR population to the ending population. The minimum view combines revenue, logos, cohorts, and concentration so the headline percentage can be challenged rather than merely repeated.
Use this board-ready control table:
| Required view | Minimum fields | Control question |
|---|---|---|
| Cohort boundary | Period start, period end, cohort rule | Are both snapshots using the same customers? |
| ARR bridge | Starting ARR, churn, contraction, expansion, ending ARR | Does the bridge reproduce reported NRR? |
| Logo bridge | Starting logos, churned logos, ending logos | How many customer relationships were lost? |
| Gross retention | Starting ARR, churn, contraction | What was retained before expansion? |
| Cohort analysis | Acquisition period, tenure, segment, channel | Which populations improved at the same age? |
| Expansion concentration | Top 1, top 5, and top 10 account shares | How dependent is NRR on a few customers? |
| Data reconciliation | CRM, contract, billing, and general-ledger totals | Can finance trace every movement to source data? |
The ARR bridge should obey one identity:
Ending cohort ARR = Starting ARR - churn - contraction + expansionKeep new-logo ARR outside this bridge. Report it beside retention, not inside it. Also state whether pricing changes, foreign exchange, acquisitions, or contract reclassifications affect comparability.
In HubSpot, preserve monthly or quarterly snapshots rather than relying only on mutable current properties. A live company record can tell you today’s ARR, but it cannot reconstruct a defensible beginning cohort after deals, line items, or lifecycle stages have changed.
How can cohort analysis separate real improvement from a mix shift?
Cohort analysis separates real improvement from customer-mix change by comparing like with like. Group customers by acquisition period, segment, channel, plan, or tenure, then compare each group at the same age instead of reading one blended company average.
The cohort retention analysis method should answer two distinct questions:
- Within-cohort change: Did customers with similar characteristics retain better than comparable customers did at the same tenure?
- Between-cohort mix: Did the total rise because more revenue now comes from historically sticky segments?
Suppose enterprise retention stays at 95% and SMB retention stays at 70%, but enterprise grows from 30% to 60% of starting ARR. Aggregate retention will rise even though neither segment improved. That may still be good strategy, but management should call it a portfolio shift, not a retention-program win.
Report both the weighted total and the segment rows. If the aggregate improves while every comparable segment is flat, mix is doing the work. If comparable segments also improve, the business has stronger evidence that onboarding, product adoption, service, or renewal execution changed customer behavior.
Why is no single retention KPI enough?
No single retention KPI preserves customer mix, distribution, and causality. A headline number is useful for orientation, but it becomes risky when executives treat it as a complete diagnosis of customer-base health.
The history of Net Promoter Score offers a useful management-reporting analogy. The Harvard Business Review article The One Number You Need to Grow helped popularize a single executive loyalty score. A later longitudinal study covering 21 firms and more than 15,500 interviews did not find that NPS was clearly superior to other customer metrics for predicting revenue growth.
That research does not prove anything about NRR. It illustrates a recurring governance problem: an easy-to-repeat KPI can outrun the evidence and detail beneath it.
NRR is an accounting-derived outcome, not a survey score, but it still compresses churn, contraction, and expansion into one percentage. The minimum balanced set is NRR, GRR, logo retention, and cohort retention. Add expansion concentration when a small number of accounts can materially move the total.
What questions should executives ask when NRR rises?
Executives should treat rising NRR as the start of the review, not its conclusion. Seven questions reveal whether the gain reflects healthier customer behavior, a denominator problem, a changing mix, or concentrated expansion.
- Are the beginning and ending populations the same cohort?
- Are churned customers still represented as lost revenue, or have they disappeared from the denominator?
- Is all new-customer revenue excluded from NRR?
- Which acquisition cohorts, segments, plans, and tenure bands moved the total?
- How many logos were lost, and what was logo retention?
- What share of expansion came from the top one, five, and ten accounts?
- Did retention improve within comparable groups, or did the revenue mix change?
The answer should fit on one reconciliation page. If finance cannot move from the headline NRR to the underlying customer and ARR rows, the metric is not ready for a QBR or board deck.
Frequently Asked Questions
Can NRR rise while customer retention gets worse? Yes. Expansion from a few survivors can offset churn, while a changing customer mix can lift the aggregate rate even if no segment becomes more likely to stay.
What is survivorship bias in retention reporting? It is the distortion created when surviving customers are overrepresented or churned customers disappear from the comparison. The result can look healthier because the population changed.
What denominator should NRR use? Use recurring revenue from the fixed customer cohort present at the beginning of the period. Exclude new logos and count churned starting customers as zero at the end.
What should a CFO review alongside NRR? Review GRR, logo retention, cohort movement, beginning and ending ARR and logos, and the concentration of expansion among the largest accounts.
How do cohorts expose survivorship bias? They compare customers with the same acquisition period, segment, or tenure at equivalent ages. This separates real within-group improvement from a shift toward naturally stickier customers.
Survivorship bias is one reason our SaaS renewal metrics guide treats retention as a system of measures rather than one score.
Apply the same cohort controls across the HubSpot management reporting system. When results reach directors, use the seven-slide board report template and keep the starting cohort, losses, expansion concentration, and caveats visible beside the headline.
If your NRR cannot be reconciled to the same starting customer cohort, contract values, and renewal dates, it is not ready for the board. SWOTBee can help identify the reporting gaps before they become forecast surprises.
Get your 1-page renewal leakage estimate ->
Prefer to review the definitions first? Book a Renewal Alignment Call ->